-
S&P 500 in 2012: up 13.4%
-
S&P 500 in 2013: up 29.6%
-
S&P 500 in 2014: up 11.3%
S&P 500 YTD in 2015: up 1.6%
If there were such a thing as an investment time machine, we would skip the last five months or simply fast-forward over November, December, January, February, March and what we’ve seen thus far of April.
We could have taken a dirtnap in the spirit of: ‘the bear was hibernating, the bull too, and so could have been me and you.’
I guess after six years of gains (five of them double-digit), it’s kind of normal to see a period of stagnation. In fact, it probably should have been expected.
The voice of the bears has been nagging for years and bulls are ever-present. It’s about time bulls and bears share the limelight with whichever animal represents the boring middle (how about the sloth?).
According to chewed-out Wall Street wisdom, the market almost never goes up in a straight line … and that’s exactly what we’re getting right now.
The Profit Radar Report has been mentioning for months that the forces of supply and demand are basically in balance. There hasn’t been enough buying power to propel stocks higher, and not enough selling pressure to keep them down.
Never Miss a Beat! >> Sign up for the FREE iSPYETF e-Newsletter
For example, the March 29 Profit Radar Report observed that: “S&P 500 today is exactly where it was November 18, and there’s no indication that the up and down zig-zagging is coming to an end. In fact, there’s a real possibility the S&P is forming some sort of triangle.”
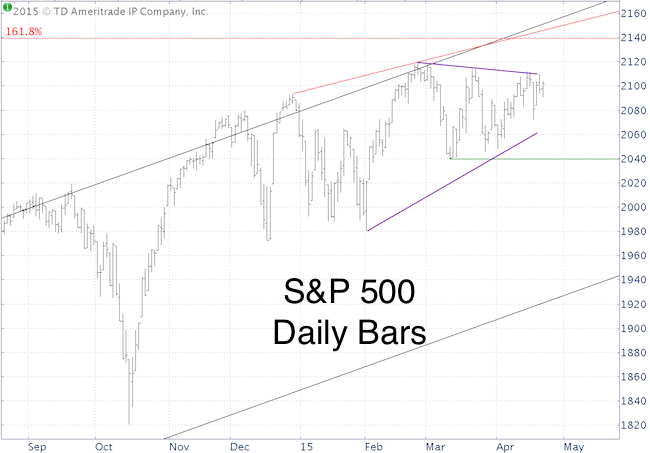
Triangle’s are notorious for keeping stocks range bound for weeks, even months. The April 8 Profit Radar Report featured this S&P 500 visual for a possible triangle (triangle boundary lines in purple).
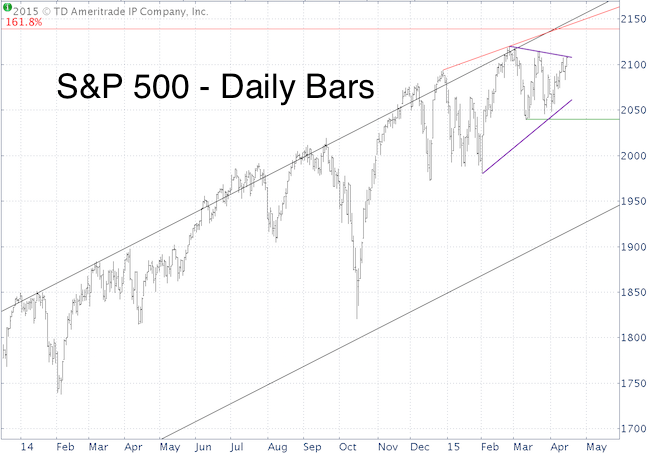
The S&P has reached the upper boundary of the projected triangle, which is the ‘do or die’ level outlined in my prior S&P 500 forecast.
If the S&P is not strongly rejected by the upper triangle boundary, it will probably continue ‘triangling’ around and eventually break higher. Even if stocks break higher though, they may soon come back ... perhaps to test the lower end of the range.
Seasonality is pointing higher, but there are two caveats with seasonality right now.
S&P 500 Seasonality – This is Not an Ordinary Year
Updated chart (4-23-2015):
Simon Maierhofer is the publisher of the Profit Radar Report. The Profit Radar Report presents complex market analysis (S&P 500, Dow Jones, gold, silver, euro and bonds) in an easy format. Technical analysis, sentiment indicators, seasonal patterns and common sense are all wrapped up into two or more easy-to-read weekly updates. All Profit Radar Report recommendations resulted in a 59.51% net gain in 2013 and 17.59% in 2014.
Follow Simon on Twitter @ iSPYETF or sign up for the FREE iSPYETF Newsletter to get actionable ETF trade ideas delivered for free.

Never Miss a Beat! >> Sign up for the FREE iSPYETF e-Newsletter
|
