A monkey that sits on the ground can’t fall from the tree, and an investor in cash can’t lose money.
Is now the time to be in cash?
We will take a closer look at the S&P 500 Index (SNP: ^GSPC) to answer this question.
The S&P 500 has arrived at an exciting juncture. Trade is ticks away from new all-time highs and in close proximity to long and short-term support/resistance zones.
The S&P 500 chart below shows some important levels worth watching.
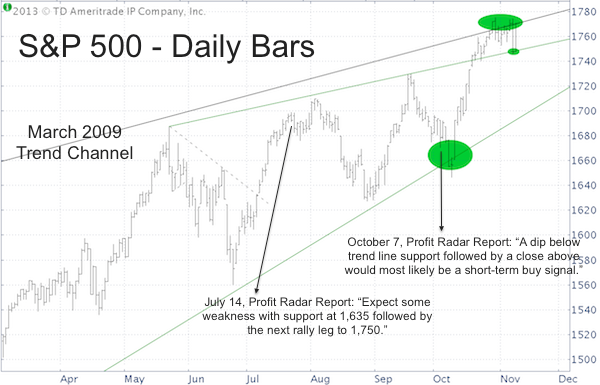
The black line is the upper line of a trend channel going back to March 2009 and has been my up side price target for several months.
The Profit Radar Report referred to this trend line when it stated back on July 14:
“The May 22 high did not look like a major market top and the current rally doesn’t have the attributes of a major high yet either. It would be reasonable to expect some weakness with support at 1,635 followed by the next rally leg to 1,750.”
On Monday the ascending trend line will be at S&P 1,771.
There are a couple of bullish factors highlighted by the green ovals.
The first green oval highlights a fake breakdown below trend line support.
The October 7 Profit Radar Report, published two days before the fake breakdown occurred, pointed out that similar prior fake out breakdowns below trend lines all resulted in new highs and stated that: “A dip below trend line support followed by a close above would most likely be a short-term buy signal.”
The inertia of this bullish trend line test propelled the S&P 500 all the way to the trend line target at 1,770, where it stalled.
The fact that the S&P 500 continues to linger around the black trend line (and found support at the green trend line) is bullish (green ovals).
Purely based on technicals, new S&P 500 highs are likely. However, …
Here’s the rub: Investors have no fear. A number of money flow indicators suggest most investors are ‘all in’. The term complacency almost isn’t enough to describe the prevalent level of optimism.
From a contrarian point of view, that’s a red flag for stocks.
Here’s how things may shake out.
Odds favor a new S&P 500 high. The new high may be short-lived and followed by a correction and new highs thereafter.
For right now, I’m a ‘monkey on the ground,’ but there a specific trigger levels that will unlock the next trade and target (update: the Profit Radar Report went long the S&P 500 at 1,775 on November 13).
Detailed trade ideas and target levels are available via the Profit Radar Report.
Simon Maierhofer is the publisher of the Profit Radar Report. The Profit Radar Report uses technical analysis, dozens of investor sentiment gauges, seasonal patterns and a healthy portion of common sense to spot low-risk, high probability trades (see track record below).
Follow Simon on Twitter @ iSPYETF or sign up for the iSPYETF Newsletter to get actionable ETF trade ideas delivered for free.

|
