After this week’s ‘drop and pop’ I stumbled across this head line: “If this were 2013, the market correction would be over. But now?”
That’s an intriguing question and if you’re wondering the same thing, you may find the following S&P 500 analysis enlightening.
The 2-hr S&P 500 (SNP: ^GSPC) chart below provides a lot of clues for the short-term and we’ll talk about some mid-and long-term tell-tale indicators a bit later.
The S&P 500 chart below (initially published in the February 3 and 5 Profit Radar Reports) outlines the effect of technical support/resistance levels on the S&P 500.
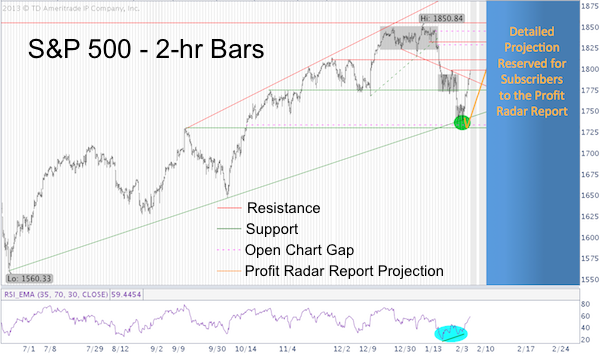
The February 3 Profit Radar Report stated: “Even though today was a rare 90% down day (90% of all stocks traded closed lower) there was a bullish RSI divergence. This suggests that selling pressure is subsiding. There is minor support around 1,730 and an open chart gap at 1,733.45. Chart gaps often act as magnet. Ideally the market will deliver another minor up/down wiggle and close the gap before staging a larger bounce.”
The yellow line offers a visual projection (published in the February 5 Profit Radar Report) of the ideal path for the S&P 500 (NYSEArca: SPY).
As proposed, Wednesday’s market action delivered the minor ‘up/down wiggle,’ but the rally started without prior closure of the open chart gap (this probably remains on the ‘to-do list’ for later).
As the headline above suggested, if this were 2013, the correction would probably be over. But this isn’t 2013 and the weight of evidence suggests another leg down following the completion of this bounce. Significant resistance for this bounce is around 1,810 and 1,830. A zig-zag shapped bounce (or A-B-C) to relieve the oversold condition is quite common.
Such a bounce is likely to be a ‘sucker bounce’ delivering a better buying opportunity a bit down the road.
Mid-and Long-term Outlook
The lack of bearish divergences at the recent all-time high suggests new all-time highs following the completion of this correction, but two powerful long-term stock market cycles point towards a major market top in 2014.
Needless to say, 2014 should be an exciting year for bulls and for bears.
A detailed 2014 forecast along with a projected path (yellow lines) is available for subscribers to the Profit Radar Report.
A closer look at the two powerful stock market cycles projecting a major market top in 2014 is available for free here:
2 Monster Stock Market Cycles Project Major S&P 500 Top in 2014
Simon Maierhofer is the publisher of the Profit Radar Report. The Profit Radar Report presents complex market analysis (S&P 500, Dow Jones, gold, silver, euro and bonds) in an easy format. Technical analysis, sentiment indicators, seasonal patterns and common sense are all wrapped up into two or more easy-to-read weekly updates. All Profit Radar Report recommendations resulted in a 59.51% net gain in 2013.
Follow Simon on Twitter @ iSPYETF or sign up for the FREE iSPYETF Newsletter to get actionable ETF trade ideas delivered for free.

|
