According to CNBC, Dr. Doom is worried about a crisis bigger than 2008, and so should you.
There truly are reasons to expect some weakness (aka the ‘May Blues’), but perhaps just not yet.
Why Look for May Blues
1. Seasonality: S&P 500 seasonality for midterm election years is bearish. Click here for S&P 500 seasonality chart.
2. The Nasdaq-100 may be carving out a head-and shoulders pattern. Click here for Nasdaq chart with HS annotations and explanation.
3. Stock market breadth is deteriorating. A truly rising tide lifts all boats, this rally isn’t. Large caps are in, small caps are out.
The chart below plots the S&P 500 (SNP: ^GSPC) against the IWM:IWB ratio. The IWM ETF represents the small cap Russell 2000, the IWB ETF represents the large cap Russell 1000.
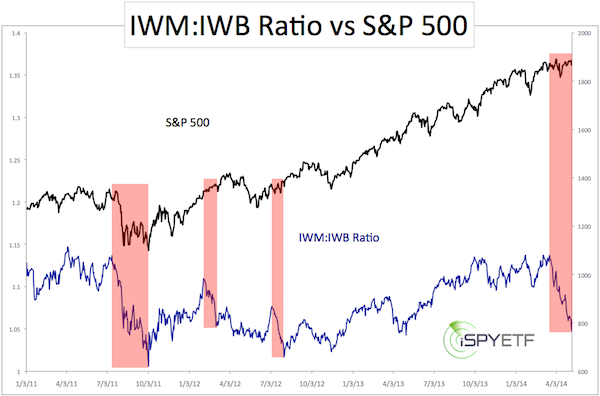
The IWM:IWB ratio shows small caps quickly erasing an 11-months performance advantage.
Although this is a reflection of fragmentation, it should be said that, historically, this disparity does not foreshadow major immediate weakness.
Why Look for May Blues … Later
Simply because the media is looking for a crash right now.
CNBC: “I’m worried about a crisis bigger than 2008: Dr Doom”
MarketWatch: “Risk of 20% correction highest until October”
Investors Business Daily: “Why investors expect to ‘sell in May and go away’”
CNBC: “Wells Fargo strategist presents scary chart”
Based on various cycles, technical indicators and seasonal patterns, the Profit Radar Report proposed a May high back in January when it published the 2014 Forecast.
This outlook continues to be valid, however, it has now become the crowded trade.
The market will likely find a way to shake out the weak and premature bears, and fool the herd (the May 4 Profit Radar Report outlined the most likely route of this head fake).
In terms of technicals, the S&P 500 (NYSEArca: SPY) remains above important support and still within a chopping zone, obviously designed to hurt impatient investors. As long as this support holds, it’s dangerous to go short.
Even the weak Russell 2000 remains above an important support cluster (yes, more important than the 200-day SMA).
What about investor sentiment? A number of outlets continue to refer to ‘extreme investor optimism.’ True, there are some pockets of investor optimism, but ironically the disparity between bullish investment advisors (the pros) and retail investors has rarely been greater.
What does this mean? Here’s a chart that answers this very question:
Retail Money is Much more Bearish than the Pros – What Does it Mean?
Simon Maierhofer is the publisher of the Profit Radar Report. The Profit Radar Report presents complex market analysis (S&P 500, Dow Jones, gold, silver, euro and bonds) in an easy format. Technical analysis, sentiment indicators, seasonal patterns and common sense are all wrapped up into two or more easy-to-read weekly updates. All Profit Radar Report recommendations resulted in a 59.51% net gain in 2013.
Follow Simon on Twitter @ iSPYETF or sign up for the FREE iSPYETF Newsletter to get actionable ETF trade ideas delivered for free.

|
