About a month ago we looked at the Russell 2000 (small cap stocks) and S&P MidCap 400 (mid cap stocks) indexes to determine whether there’s more down side for the broader market.
Our focus was in particular on the trend line that connected the October 2011 low with all subsequent lows. It was a well-defined support level that created a pretty technical picture.
On November 7/8 the Russell 2000 (corresponding ETF: iShares Russell 2000 ETF – IWM) and S&P MidCap 400 Index (corresponding ETF: SPDR S&P MidCap 400 ETF – MDY) dropped below their respective trend lines.
This foreshadowed lower prices ahead and triggered a sell signal. However, the quick sell off left open chart gaps (particularly for the Nasdaq-100), that’s why the Profit Radar Report didn’t wholeheartedly embrace the post-election sell off and sold S&P 500 short positions at 1,348.
Fast-forward a couple of weeks and we see the MidCap 400 Index back above trend line resistance (previously support) and the Russell 2000 Index butting up against trend line resistance.
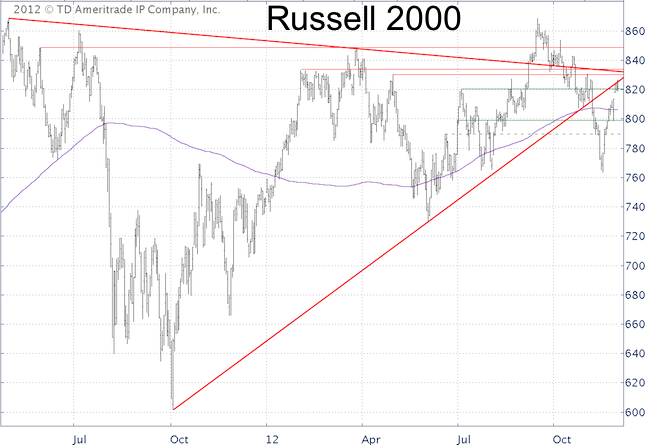
The first chart below provides a closer look at the Russell 2000 (support is colored green, resistance red). Right beyond the red trend line resistance is another resistance cluster made up of a descending trend line and previous highs/lows.
So there’s a strong resistance range ahead for the Russell 2000 (the same is true for the S&P 500) and it may take a couple of attempts to push beyond. The beginning of December tends to have a brief seasonal lull, which (combined with resistance) may drive the Russell 2000 (and stocks in general) a bit lower.
But small caps in particular sport a strong bullish seasonal bias starting in mid-December.
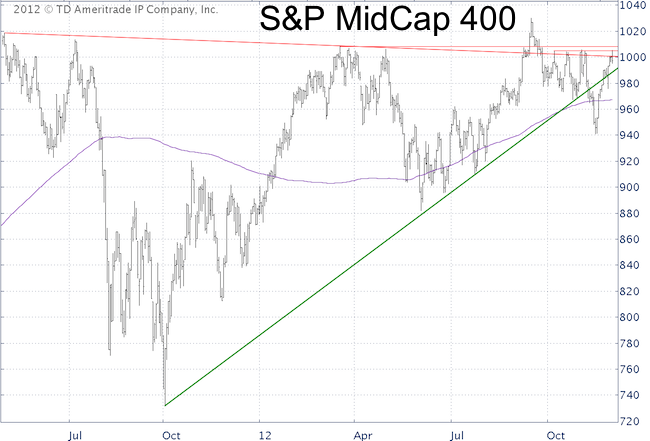
Mid caps have performed a bit better as they have already pushed above trend line resistance, now support. Nevertheless, resistance made up of prior failed highs is straight ahead.
The technical picture for mid caps looks more bullish than that of small caps, but even mid caps have room to retest the green support line before making another run higher.
Both indexes and their corresponding ETFs trade above their up sloping 200-day SMAs.
|
