Much has been written about the bearish divergence between the Dow Jones and S&P 500 compared to the Nasdaq and Nasdaq-100.
In fact, the Nasdaq-100 is trading 4.5% below its 2012 high, while the S&P 500 is trading more than 2% above its 2012 high water mark.
This could be (and has been) interpreted as a bearish sign, but that’s not necessarily the case.
For better and for worse the Nasdaq-100 has been hijacked by one stock – Apple. A few months ago Apple accounted for more than 20% of the index. As Apple went, so did the Nasdaq-100 (more about the correlation between Apple and Nasdaq here).
Just in September, Apple drove the Nasdaq-100 to the highest point since the 2000 tech bubble. Since then Apple lost as much as 35%. Apple’s decline has been a significant drag on the Nasdaq (corresponding ETF: PowerShares QQQ) and technology sector (corresponding ETF: Technology Select Sector SPDR – XLK).
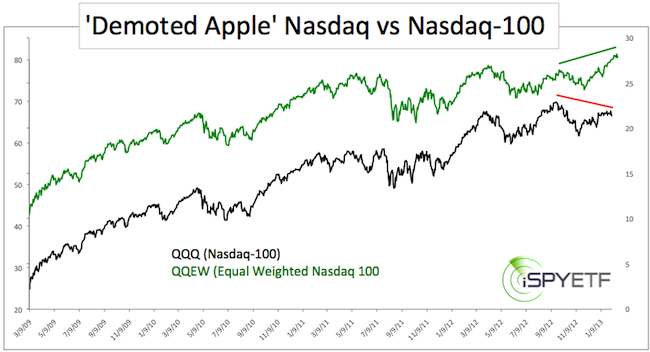
Apple’s performance is holding the Nasdaq back from reaching new recovery highs, but the Nasdaq-100 without Apple’s drag (aka ex-Apple Nasdaq-100) would trade at new 12-year highs.
I haven’t figured out a way to reconstruct an exact ex-Apple Nasdaq-100 index, but a comparison between the PowerShares QQQ ETF and First Trust Nasdaq-100 Equal Weight ETF (QQEW) illustrates the point.
QQEW assigns an equal weight to all Nasdaq-100 components. The equal weight approach doesn’t eliminate Apple, but it comes close to an ex-Apple Nasdaq index.
The first chart plots the price of QQQ against QQEW since the March 2009 low.
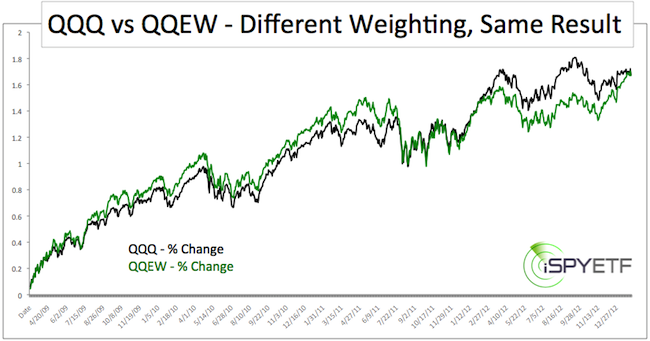
The second chart shows the percentage gain of QQQ and QQEW since March 9, 2009. Although QQQ and QQEW took different routes, both ETFs gained exactly 167% from March 9, 2009 – February 1, 2013.
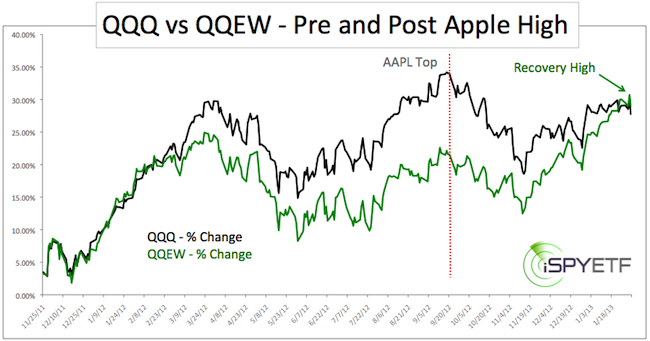
The steepest portion of AAPL’s ascent started on November 25, 2011. Within the next 10 months AAPL soared from 370 to 705. The powerful rally was followed by a gnarly 35% drop.
The third chart captures the period from November 25, 2011 – February 2013. This period includes Apple’s steep ascent and subsequent descent. The equal weighted Nasdaq-100 ETF (QQEW) clocked in at the highest level since December 2000 just a couple of days ago.
Never before has any one single stock exerted so much power on the stock market as a whole. This illustrates that extraordinary times call for ‘extraordinary’ and out of the box analysis.
Stripped of Apple’s performance, the Nasdaq-100 is trading at new recovery highs, thus erasing the bearish divergence between the senior U.S. indexes. This doesn’t mean stocks can’t decline, but it won’t be because of a true bearish divergence.
|
