How did the stock market’s actual 2013 performance match up to the Profit Radar Report’s 2013 forecast?
In short, 2013 was a frustrating but still rewarding year.
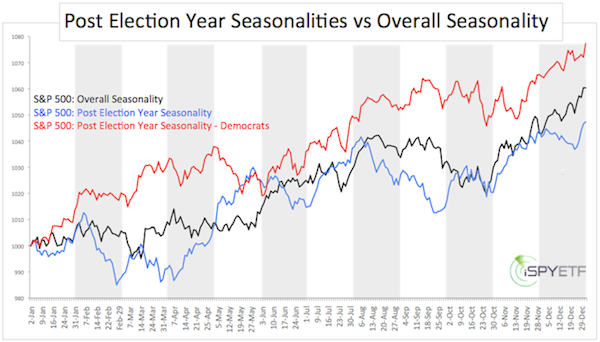
In the 2013 forecast, the Profit Radar Report noted that: “2013 started with a bang as the S&P 500 gained 5% in January. The Santa Claus Rally, First 5 Days, and the January Barometer are all positive. Since 1950 that’s happened 16 times. The S&P 500 finished with full-year gains each of the 16 times. The post-election year performance under Democratic presidents is much more bullish than post-election and overall seasonality.” (chart below published in the Profit Radar Report’s January 15, 2013 Seasonality Forecast)
How could the year be frustrating if the early indicators pointed towards a strong year?
Early indicators not only pointed towards a strong year, they also suggested a correction is needed to help the S&P 500 (SNP: ^GSPC) digest some of its gains.
But there was no real correction from January to May 2013, which made it difficult to find low-risk entry points.
Rather than rehashing every trade we made (or didn’t make), we can just look at our overall track record.
In June we asked subscribers to participate in a survey. We wanted to know what we’re doing well and what needs to be improved.
The basic response to the survey was: “You are doing a great job, but you need to better identify buy/sell levels for trades and start keeping track of gains/losses.”
We did just that and performance tracking started on July 11, 2013.
Since July the Profit Radar Report made 24 definite buy/sell recommendations.
Recommendations covered the following indexes, asset classes: S&P 500 and S&P 500 ETF (NYSEArca: SPY), Nasdaq and Nasdaq QQQ ETF (Nasdaq: QQQ), Dow Jones and Dow Jones ETF (NYSEArca: DIA), dollar and euro futures and ETFs, gold futures and SPDR Gold ETF (NYSEArca: GLD), silver futures and Silver Trust ETF (NYSEArca: SLV), and others.
The net gain of all 24 recommendation made was 28.34% since July 11 (59.51% annualized). Our worst trade lost 1.02%.
The performance (59.51% annualized gain, with 1.02% being the worst loss), really shows our commitment to spotting low-risk, high probability trades.
The full 2014 forecast is being prepared right now and will be available to subscribers soon. Click here to find out more or test drive the Profit Radar Report.
The 2014 forecast includes:
-
S&P 500 seasonality charts based on 1) every year since 1950 2) every mid-term election year since 1950 3) every mid-term election year with a democratic president since 1950
-
Dominant 7-and 13-year cycle chart and the implications for 2014
-
Detailed sentiment analysis and comparison between today and 2007
-
Important support/resistance levels
-
The message of bearish divergences (or lack thereof)
-
Elliott Wave Analysis.
All the above factors are combined (like a giant market forecast puzzle) into one chart that outlines the ideal path for 2014.
Sign up for the Profit Radar Report now to be the first to access the report when it becomes available.
|
