Since 1970, the S&P 500 staged a year-end rally (often considered the Santa Claus Rally, comprised of the last five trading days of the old year, and first two trading days of the new year) 35 out of 46 years, or 76.1% of the time.
The average gain is around 1.5%. This rally has been reliable enough that investors view it as a foregone conclusion.
Despite the strong propensity for the S&P 500 (NYSEArca: SPY) to rally, the VIX has declined only 4 of the last 29 years.
This is one of those charming and somewhat inexplicable VIX anomalies.
We don’t need to understand every anomaly as long as we are aware of it.
If you enjoy quality, hand-crafted research, >> Sign up for the FREE iSPYETF Newsletter
The December 23 Profit Radar Report highlighted this quirk by comparing VIX and S&P 500 seasonality (see chart below) and stated:
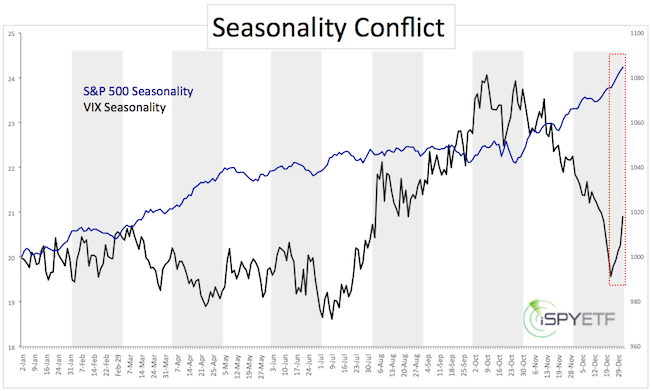
“Year-end S&P 500 seasonality is quite strong, as is VIX seasonality. This is one of those ‘charming’ VIX quirks that doesn’t make sense. Therefore, we are closing our VelocityShares Daily Inverse VIX ETN (NYSEArca: XIV) position at 34.90.”
If the VIX rises when stocks are up, imagine what happens when stocks are down. We don’t have to imagine, we just saw it.
Inverse volatility ETFs like XIV and SVXY have dropped like a rock while the iPath S&P 500 VIX Futures ETN (NYSEArca: VXX) soared like an eagle. Based on historical data, this would have happened anyway, even without S&P 500 selloff.
VIX seasonality is somewhat choppy until early March, so trading the VIX will take good timing.
Based on buying climaxes, the bias for Q1 is up: Buying Climaxes Soar to 1-year High
Simon Maierhofer is the publisher of the Profit Radar Report. The Profit Radar Report presents complex market analysis (S&P 500, Dow Jones, gold, silver, euro and bonds) in an easy format. Technical analysis, sentiment indicators, seasonal patterns and common sense are all wrapped up into two or more easy-to-read weekly updates. All Profit Radar Report recommendations resulted in a 59.51% net gain in 2013.
Follow Simon on Twitter @ iSPYETF or sign up for the FREE iSPYETF Newsletter to get actionable ETF trade ideas delivered for free.

|
