The first four months of 2014 are over. Although the S&P 500 (SNP: ^GSPC) hasn’t gone anywhere fast (up ~1.5% YTD), the average S&P 500 investor has almost certainly lost money. Why?
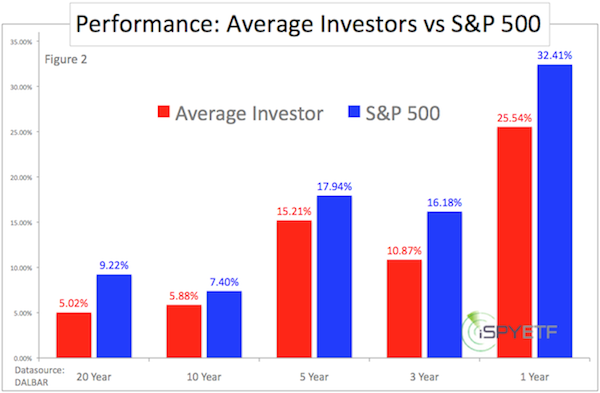
According to DALBAR’s annual behavior report, the average investor doesn’t just buy and hold. The average investor is fidgety, buys too high, sells too low, and underperforms the S&P 500 (NYSEArca: SPY) quite significantly (6.87% in 2013).
DALBAR evaluates investor behavior/performance by analyzing data from the Investment Company Institute (ICI), Standard & Poor’s, and other outlets that provide fund and money flow data.
Figures 1 and 2 will illustrate retail investors’ lack of timing. Figure 3 shows how ‘great’ professional money managers’ timing skills are.
Retail Investors’ ‘Skill’
Figure 1 plots the 2013 monthly S&P 500 performance against the monthly money flow. This illustrates the performance chasing nature of investors.
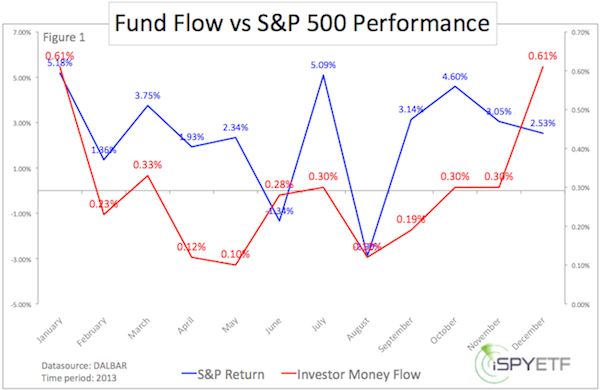
Investors tend to employ money after big gains (not before big gains or during periods of weakness). Such performance chasing (buying high) leads to sub-par returns.
Figure 2 shows how far the average investor trails behind the S&P 500.
In 2014 alone, investors chasing new all-time highs would have gotten burned three times (red dots in S&P 500 chart below).
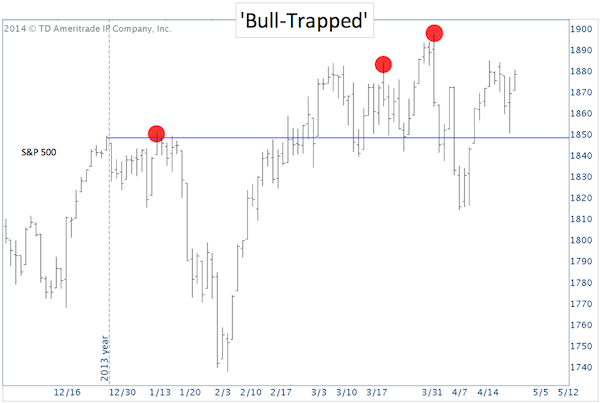
Each time the S&P 500 broke out to new highs, the Profit Radar Report warned of a ‘fake out break out.’
Did professional money managers do any better?
Money Managers – ‘Blind Leading the Blind’
Based on a survey of professional managers conducted by the National Association of Active Investment Managers (NAAIM), the timing of the ‘pros’ has been rather poor as well.
Figure 3 plots the S&P 500 against the NAAIM Exposure Index, which reflects money managers’ exposure to equities.
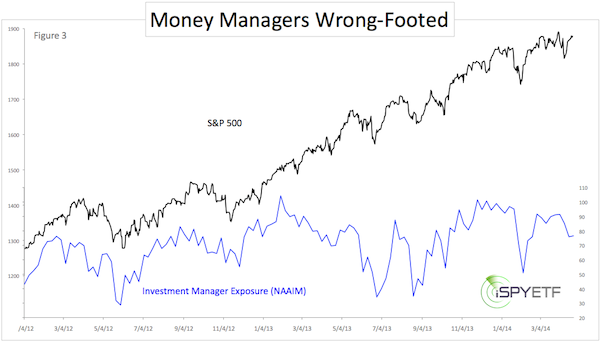
Both graphs tend to move in the same direction. This means that even money managers fall into one of those two categories: 1) Trend follower 2) Performance chaser (that’s probably why even static index funds or ETFs tend to outperform actively managed mutual funds).
The stock market may be building another trap right now. The month of May is notorious for fooling the investing herd.
This year promises to be no different, although there may be a curious twist. Should you really sell in May and go away?
Expecting ‘Sell in May and Go Away’ Pattern? – Prepare for Surprise
Simon Maierhofer is the publisher of the Profit Radar Report. The Profit Radar Report presents complex market analysis (S&P 500, Dow Jones, gold, silver, euro and bonds) in an easy format. Technical analysis, sentiment indicators, seasonal patterns and common sense are all wrapped up into two or more easy-to-read weekly updates. All Profit Radar Report recommendations resulted in a 59.51% net gain in 2013.
Follow Simon on Twitter @ iSPYETF or sign up for the FREE iSPYETF Newsletter to get actionable ETF trade ideas delivered for free.

|
