Stanford University constructed a new index that gauges media sentiment.
I’m a ‘headline junkie’ and couldn’t wait to chart the raw data of the university’s Equity Uncertainty Index. Here’s a thumbnail rundown on the index:
Equity market related uncertainty is measured through an analysis of new articles containing terms related to equity market uncertainty. Terms are subdivided into three ‘theme buckets.’
1) Uncertainty or uncertain.
2) Economy or economic.
3) Equity market, equity price, stock market or stock price.
To be included by the index, an article must include at least one word of each bucket.
Searched are about 1,000 newspapers (via a NewsBank database) throughout the United States. Newspapers include large national papers like USA Today and small neighbor papers.
The number of newspapers NewsBank covers increased from 18 in 1985 to 1,800+ in 2008. To adjust for the growth, the index normalizes the results to an average value of 100.
Interestingly, according to the University, the index has a contemporaneous daily correlation with the VIX (Chicago Options: ^VIX). The data and Equity Uncertainty Index goes back to 1985.
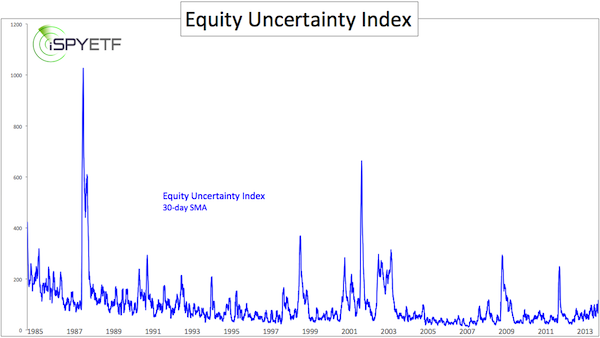
As the chart below shows, the index is rather noisy, even when illustrating the 30-day simple moving average (SMA). Of course, it’s always tricky to cram 28 years of data into a five-inch chart.
The second chart cleans up the Equity Uncertainty Index a bit and plots it against the S&P 500 (SNP: ^GSPC). For this chart we’re looking at the 90-day median average since the year 1999.
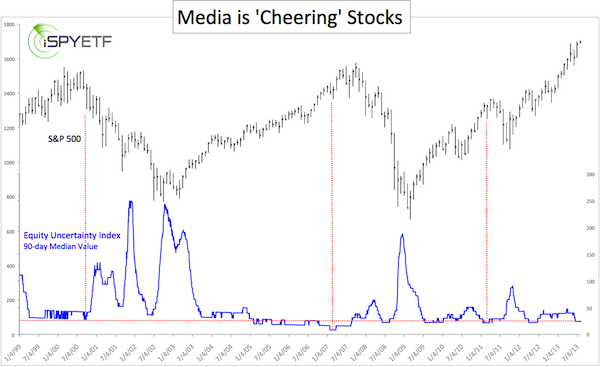
Now we are starting to see a basic correlation between media reporting and stock market action. As with most sentiment indicators, the media’s reporting bias is deeply contrarian.
Big spikes in ‘uncertainty’ – much like the VIX ‘fear’ Index (NYSEArca: VXX) – generally mark a major market bottom.
Complacency, or the lack of uncertainty can (but don’t have to) be trouble for the S&P 500 (NYSEArca: SPY) and the broad market.
I look at headlines every day and compose my very own, non-scientific media index.
For example, below is my observation published in the March 10, 2013 issue of the Profit Radar Report:
“The Dow surpassed its 2007 high and set a new all-time high last week, but investors seem to embrace this rally only begrudgingly and the media is quick to point out the ‘elephant in the room’ – stocks are only up because of the Fed. Below are a few of last week’s headlines:
CNBC: Dow Breaks Record, But Party Unlikely To Last
Washington Post: Dow Hits Record High as Markets are Undaunted by Tepid Economic Growth, Political Gridlock
The Atlantic: This Is America, Now: The Dow Hits a Record High With Household Income at a Decade Low
CNNMoney: Dow Record? Who Cares? Economy Still Stinks
Reuters: Dow Surges To New Closing High On Economy, Fed’s Help
We know this is a phony rally, but so does everyone else. We know this will probably end badly eventually, but so does everyone else. The market likes to fool as many as possible and it seems that overall further gains would befuddle the greater number. Excessive optimism was worked off by the February correction. Sentiment allows for further gains.”
Looking at the chart, we see that the media is somewhat, but not extremely complacent.
I wouldn't use this indicator as a timing tool, but it’s a fun study and potential warning.
Other sentiment and money flow indicators on the other hand are very powerful and have correctly foreshadowed market tops and market bottoms. With stocks at all-time highs we're scouting signs for a market top.
This article is long enough already, but you may check out what other sentiment and money flow indicators 'say' about the potential for a looming market top. Here is: A Detailed Look at 5 Different Sentiment Gauges
Simon Maierhofer is the publisher of the Profit Radar Report.
Follow Simon on Twitter @ iSPYETF
|
