Stocks haven’t gone anywhere for a couple of weeks and there’s a reason why.
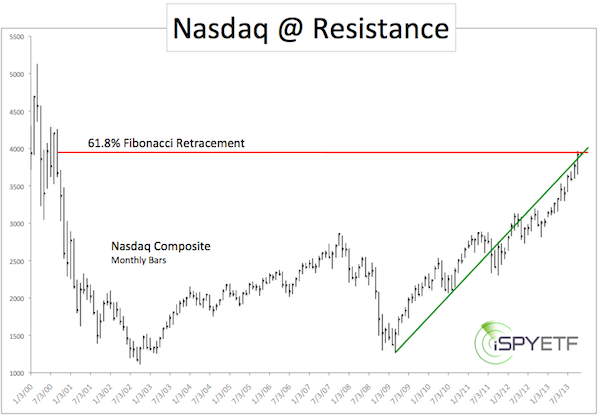
The charts below show long-term technical resistance for the S&P 500 (SNP: ^GSPC) and Nasdaq Composite (Nasdaq: ^IXIC).
Technical resistance for stocks is kind of like a traffic light for cars. A car isn’t guaranteed to stop at a traffic light, but it’s more likely to stop at a traffic light than anywhere else.
The S&P 500 chart shows that technical resistance is made up of a 55-month old trend channel.
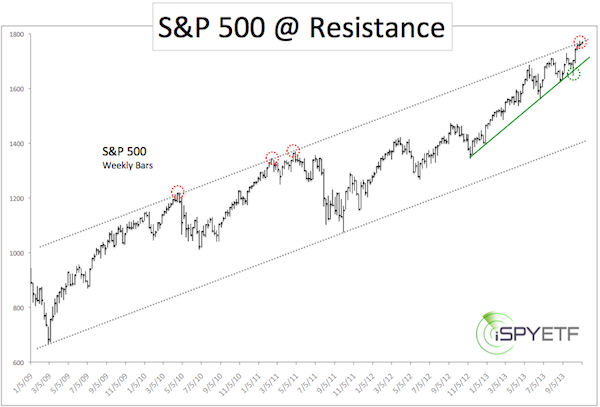
The Profit Radar Report has been tracking the trend channel since early 2013. This trend channel served as a natural target for stocks.
Back on July 14, the Profit Radar Report stated that: “The May 22 high did not look like a major market top and the current rally doesn’t have the attributes of a major high yet either. It would be reasonable to expect some weakness with support at 1,635 followed by the next rally leg to 1,750.”
The July forecast was confirmed by the October 7, Profit Radar Report, which stated: “The scenario that appears to make most sense is a quick trip into the 1,660s or 1,650s followed by another rally to new all-time highs.”
The Nasdaq (Nasdaq: QQQ) resistance goes back as far as 2000. The red line represents the 61.8% Fibonacci retracement level (a common turning point for counter trend rallies). The green trend line connects the 2009 with the 2010 low.
Temporary Stop or U-Turn
The S&P 500 (NYSEArca: SPY) and Nasdaq Composite have both stopped at their respective ‘traffic lights.’
Is this just a temporary stop (until the light turns green) or a full U-turn?
Although there is one pattern that suggests a continuation of the rally (more details here: The Secret QE Bull Market Trade Pattern that Almost Never Fails) or a brief throw over, truth be told, technical analysis alone doesn’t provide the answer.
Is it Time to Bet Against the Crowd?
Investors have become increasingly enthusiastic about stocks and for the first time in many months we are seeing real sentiment extremes.
But does sentiment still work as a contrarian indicator in a QE-skewed market?
This article takes a detailed look at the relationship between sentiment readings and stock prices in the QE bull market:
Assessing QE Bull Market Longevity Based on Investor Sentiment
Simon Maierhofer is the publisher of the Profit Radar Report.
Follow Simon on Twitter @ iSPYETF or sign up for the FREE Newsletter.
|
