Some people think there’s a 50% chance of booking a profitable trade.
That’s not quite right. To book a profit, the position traded has to:
-
Move in the ‘right’ direction (those odds are 50%).
-
Be sold while profitable. If greed for bigger profits makes us hold on too long, we may end up with a losing position.
The odds of being happy with a trade are way below 50%. Here's why:
-
We are never happy with a losing trade.
-
We are not necessarily happy with a winning trade.
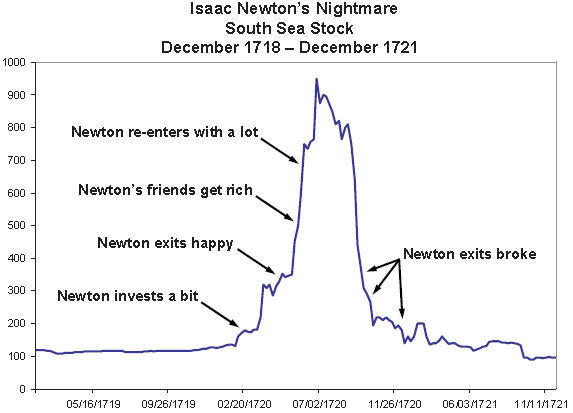
To illustrate: How do you feel if you close a trade with a 10% profit? Happy. How do you feel if the stock rallies another 20% after you closed your position? Not so happy, although nobody took your 10% gain away.
Legend has it that even Isaac Newton experienced the emotional cruelty of investing/trading. The chart below chronicles his unfortunate experience.
My Worst Performing Trade
Going from Sir Isaac Newton to Simon Maierhofer is quite a leap, but nevertheless, here’s my worst trade of 2013.
In terms of performance, my worst trade of 2013 ended with a 1.02% loss. I recommended going short gold at 1,271 on October 11. We had the direction right, but got stopped out a few days later at 1,284.
(Trades and performance of trades is based on recommendations given via my Profit Radar Report. I started keeping track of every trade on July 11, 2013, right after performance tracking was an overwhelming request made in our June 2013 subscriber survey.)
My actual worst trade was one not taken. This phantom trade stung for a number of reasons. Allow me to explain.
The Worst Trade was a Phantom Trade
In late November the Profit Radar Report expected an early December correction followed by a rally to new highs around 1,840 for the S&P 500 (SNP: ^GSPC).
It was this Dow Jones chart that provided the trigger for the early December correction. Right after the Dow Jones moved above and back below the red trend line (which goes all the way back to the year 2000), we went short at Dow Jones (DJI: ^DJI) 16,100.
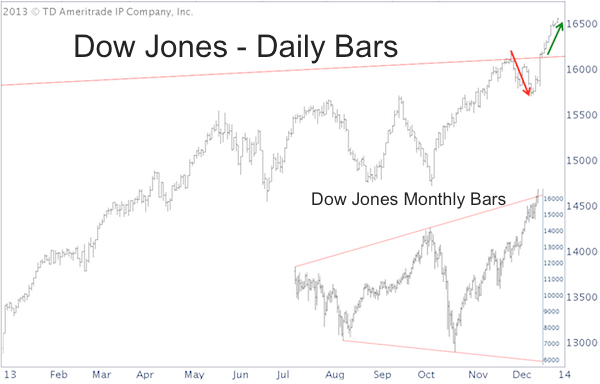
We covered our short position at 15,745 for the simple reason outlined in the December 13 Profit Radar Report: “Almost all 2013 corrections have been on the shallow side, so we’ll do the prudent thing and take our profits off the table. Nobody has ever gone broke taking profits.”
Regarding the next leg higher, the December 15 Profit Radar Report added the following: “A brief dip below support (50-day SMA) followed by a close back above resistance would be a buy signal. Similar signals have foreshadowed the onset of the next rally leg several times this year.”
The Dow Jones (NYSEArca: DIA) didn’t quite make it below the 50-day SMA and the S&P 500's (NYSEArca: SPY) dip below the 50-day SMA was so brief and the ensuing rally (the 2-hours after the December 18 Fed meeting) so swift that we didn’t get in on time.
We had the trade and the market’s direction mapped out correctly, but missed it. That burns.
This is just another reason why investing/trading is a tough business. You can be unhappy even with trades you didn’t take. Fortunately we had no ‘Isaac Newton trade.’
The Profit Radar Report recommended 24 trades since July 2013 (when it started performance tracking as per our subscribers' request).
You may wonder how it is possible that even the worst trade showed only a 1.02% loss (the cumulated net gain of all 24 trades since July was 28.34%).
The reason is deceptively simple and has to do with what I call legal insider information. Here’s a detailed look at how to minimize losses and maximize gains.
Insider Trading Just Became Legal – Maximize Gains and With Rock-Bottom Risk
Simon Maierhofer is the publisher of the Profit Radar Report. The Profit Radar Report presents complex market analysis (stocks, gold, silver, euro and bonds) in an easy format. Technical analysis, sentiment indicators, seasonal patterns and common sense are all wrapped up into two or more easy-to-read weekly updates. We are accountable for our work, because we track every recommendation (see track record below).
Follow Simon on Twitter @ iSPYETF or sign up for the FREE iSPYETF Newsletter to get actionable ETF trade ideas delivered for free.

|
