Price is always the final arbiter and thanks to the Federal Reserve the markets can (and will) stay irrational longer than investors can stay solvent.
However, price is not the only thing that matters and often a look under the market’s ‘hood’ pays.
In recent weeks we’ve seen a few covert cracks in the bull’s armor.
1) The percentage of S&P 500 (SNP: ^GSPC) stocks above their 50-day simple moving average (SMA) has fallen from 87% on October 22 to 75.5% on Friday.
2) The number of new Nasdaq (Nasdaq: ^IXIC) highs dropped from 445 on October 18 to 338 on Friday (there were only 182 yesterday).
Breadth divergences like that don’t happen overnight and don’t cause stocks – in this case the S&P 500 and Nasdaq – to drop overnight. It’s a process that takes days and more commonly weeks.
That’s why, despite weakening participation, the Profit Radar Report maintained its up side targets of 1,810 for the S&P 500 and 16,150 for the Dow Jones (the Profit Radar Report recommended to close out long positions at S&P 500 1,810 and go short at Dow Jones 16,100).
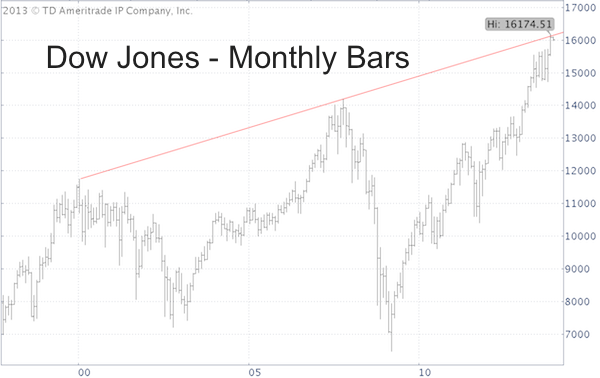
What’s so special about Dow 16,150?
If you’ve been reading my articles, the chart below is old news.
This Dow Jones (DJI: ^DJI) monthly bar chart shows a 13-year trend line, which the Dow tagged on Friday.
Breadth divergences, like the ones mentioned above, reveal market weakness and caution of some sort of correction. But when does the correction actually materialize?
Resistance levels like the one illustrated in the long-term Dow Jones chart help identify the most likely ‘point of recognition,’ the price levels where bearish divergences are likely to turn into corrections.
Resistance levels (like the above or Fibonacci resistance, supply/demand resistance, head-and shoulders resistance) can act like a financial GPS that provides the most likely digits for a turn.
Of course, it may be pre-mature to write about a direction. One down day doesn’t make a trend and the Profit Radar Reports uses stop-loss levels (in this case for our Dow Jones short position) to protect against the ‘unexpected.’
Ongoing analysis for the S&P 500, Dow Jones and Nasdaq is available to subscribers via frequent Profit Radar Report updates. Each update is in depth but concise with actionable ideas.
Follow Simon on Twitter @ iSPYETF or sign up for the FREE iSPYETF Newsletter to get actionable ETF trade ideas delivered for free.

|
