Living in San Diego, I get to pick up some surfer slang, such as: “Hey dude, this wave was gnarly.”
Coming from Germany, I had never heard the term ‘gnarly’ before. A look at the urban dictionary shows synonyms such as crazy, wicked nasty or rad.
Turns out, in San Diego beach cities, many things are ‘gnarly,’ not just the waves (this could include an accident, girl or even a breakfast burrito).
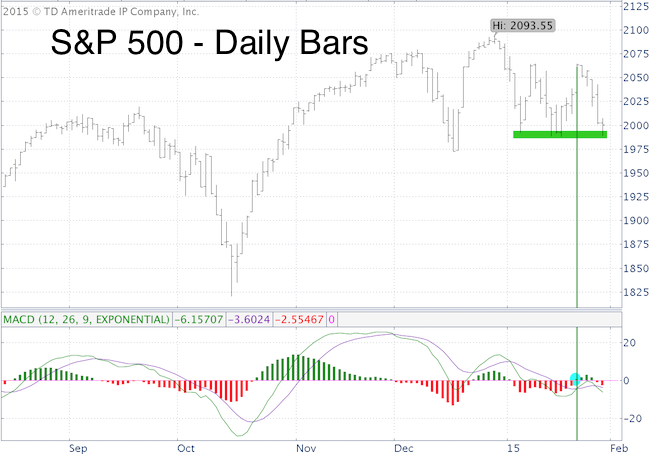
On January 22, when the S&P 500 closed at 2,064, MACD triggered a ‘gnarly’ buy signal (see green line in chart below). Why gnarly?
Via the Profit Radar Report, I noted the MACD buy signal and warned:
“According to proprietary internal supply & demand measures, this recent rally leg has been weak. However, the S&P closed above the 20 and 50-day SMAs for two consecutive days and trend following technicals like MACD have turned positive.
The purpose of the current up move is to lure investors back into stocks and elicit a level of optimism before the hammer drops again.
A reversal lower would certainly baffle many market technicians. My research still favors the odds of a reversal.”
In hindsight, it becomes obvious that the MACD buy signal was indeed wickedly gnarly. The S&P 500 dropped like a rock right after the buy signal. This illustrates the pitfall of basing buy/sell decisions solely on popular gauges, such as the 20 and 50-day SMA or MACD.
Yesterday’s decline triggered a MACD sell signal, but support around 1,988 has held thus far. Depending on today’s close, the S&P 500 (NYSEArca: SPY) may even paint a green reversal candle.
Today’s close could be important for the short-term, but – with or without bounce – I anticipate another leg down as outlined in the January 19 Profit Radar Report:
“More follow through strength is likely with resistance at 2,040 – 2,075. The odds for another leg starting at 2,040 – 2,070 are above average. Potential down side target is 1,960 – 1,900. Going short around 2,050 is most attractive from a risk/reward perspective. We do expect new highs eventually, but another leg down first looks to be in the cards.”
Perhaps we get another bounce to 2,075, followed by a drop to 1,960 – 1,900 and new recovery highs thereafter.
Continued updates will be available to subscribers of the Profit Radar Report.
Simon Maierhofer is the publisher of the Profit Radar Report. The Profit Radar Report presents complex market analysis (S&P 500, Dow Jones, gold, silver, euro and bonds) in an easy format. Technical analysis, sentiment indicators, seasonal patterns and common sense are all wrapped up into two or more easy-to-read weekly updates. All Profit Radar Report recommendations resulted in a 59.51% net gain in 2013 and 17.59%.
Follow Simon on Twitter @ iSPYETF or sign up for the FREE iSPYETF Newsletter to get actionable ETF trade ideas delivered for free.

|
