The last short-term S&P 500 forecast was published on July 14, when the S&P 500 closed at 2,109, and included the following forward guidance:
“Stocks are reaching overbought territory, so resistance at 2,115 – 2,125 is worth watching for a pullback or relapse. Support (and an open chart gap) around 2,080 may be a low-risk spot to buy. Failure to hold 2,080 and more importantly 2,040, could unlock much lower targets.”
If you enjoy quality, hand-crafted research, >> Sign up for the FREE iSPYETF Newsletter
Resistance held. At the time of analysis (July 14), 2080 seemed like THE key level, but late last week I discovered the following S&P 500 pattern, shared via Sunday’s (July 26) Profit Radar Report.
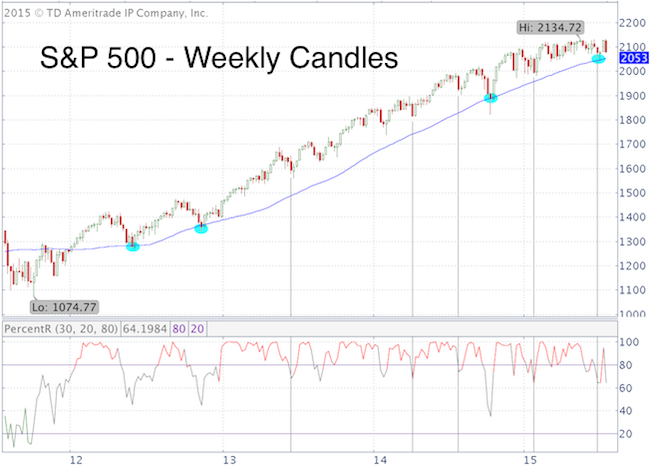
“The weekly S&P 500 chart shows three developments worth a look.
-
Since 2012, the S&P 500 found support at or near the 50-week SMA several times.
-
Last week’s red candle put in a bearish engulfing week and painted a formation called ‘bearish harami’. In recent times, bearish haramis haven’t been as bearish as they used to be.
-
Last week’s drop triggered a bullish percentR low-risk entry (click here for explanation of percentR).
In itself, none of the above three developments allows for a high probability forecast, but when combined, they would allow for a brief intra-week test of the 50-day SMA (2,053) without ‘killing’ the option of another high before a deeper correction into October.”
This week, the S&P 500 fell within 8 points of its 50-week SMA and S&P bounced again.
S&P 500 seasonality suggests higher prices, but breadth is terrible. With or without new highs (target remains around and above S&P 2,140), a deeper correction (possibly into October) is likely.
A move below the 50-week SMA and support at 2,040 would caution that the correction has begun.
Continued S&P 500 analysis is available to subscribers of the Profit Radar Report.
Simon Maierhofer is the publisher of the Profit Radar Report. The Profit Radar Report presents complex market analysis (S&P 500, Dow Jones, gold, silver, euro and bonds) in an easy format. Technical analysis, sentiment indicators, seasonal patterns and common sense are all wrapped up into two or more easy-to-read weekly updates. All Profit Radar Report recommendations resulted in a 59.51% net gain in 2013 and 17.59% in 2014.
Follow Simon on Twitter @ iSPYETF or sign up for the FREE iSPYETF Newsletter to get actionable ETF trade ideas delivered for free.

If you enjoy quality, hand-crafted research, >> Sign up for the FREE iSPYETF Newsletter
|
