A novice wouldn’t be able to distinguish fool’s gold from real gold. Even gold experts have trouble telling the difference. Miners have come up with the acid test to avoid getting fooled.
Most metals tend to bubble or fizzle when they come into contact with acid, precious metals don’t. Placing a small drop of a strong acid, such as nitric acid, onto the metals surface quickly and unmistakable differentiates real gold from fool’s gold.
Is this gold rally the real deal or is it a fool’s gold rally?
The results of this analysis won’t be as conclusive as the acid test for gold (nothing ever is in investing), but there are some worthwhile indicators to consider.
CBOE Gold Volatility Index
The April 28, 2013 Profit Radar Report examined a pattern in the CBOE Gold Volatility Index to ascertain if the April low at 1,321 was here to stay.
The CBOE Gold Volatility Index is basically a VIX for gold as the VIX methodology is applied to options on the SPDR Gold Shares (NYSEArca: GLD).
An update chart of GLD plotted against the Gold VIX is shown below. Major gold lows in 2010 and 2011 occurred against positive gold VIX divergences, where gold prices dropped to a new low, but the Gold VIX didn’t.
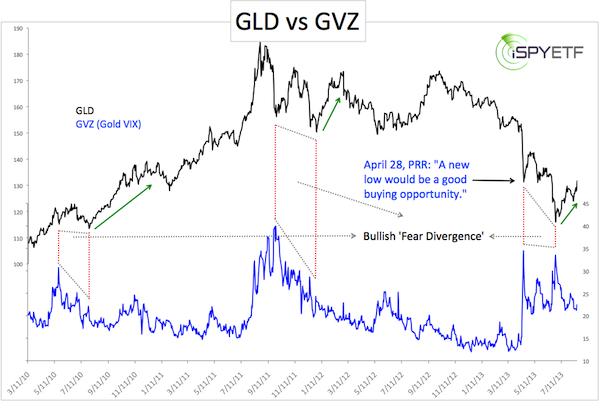
Such divergences are nothing new. I’ve used similar divergences between the S&P 500 (SNP: ^GSPC) and the VIX (Chicago Options: ^VIX) to nail major stock market lows in March 2009, October 2011, and June 2012. See S&P500 Forecasting History for more details.
There was no such divergence in April 2013 when gold (NYSEArca: IAU) dropped as low as 1,321. This suggested new lows and the April 23 Profit Radar Report stated that: “A new low would be the best buying opportunity.”
We got that new low on June 28, but it didn’t have all the hallmarks of a lasting bottom. We were long for parts of the rally from the June low, but never committed fully.
Our focus was on the iShares Silver Trust (NYSEArca: SLV) where we just closed out a very nice trade. We went long gold again with Thursday’s move above 1,345 (GLD trigger was 130.15).
The move above 1,345 is bullish, but gold has already reached your initial up side target around 1,365 (see resistance lines in chart below).
If gold can move above resistance here, it is likely to extend its rally and move to our second target. Otherwise watch out.
Gold prices have a huge effect on gold miners (NYSEArca: GDX). One unique valuation metric – which correctly predicted the 2001 and 2008 low for mining stocks – just flashed a rare signal. Read more about the Gold Miner's Signal here: By One Measure Gold Miners Are as Cheap as Ever.
Simon Maierhofer is the publisher of the Profit Radar Report.
Follow him on Twitter @ iSPYETF or sign up for the Free Newsletter.
|
