I got this e-mail from a loyal reader/subscriber the other day:
“Hi Simon, I have been following your articles for a couple of years now. First of all, wanted to thank you for doing a great job. Most of the times, you are right on the spot. Since June or July of this year, you have been comparing the market's behavior to the one of 2011's. How about 2007? I see more parallels to 2007.”
That’s right. My favorite analogy has been 2011 (click here for more details).
Like 2011 (and 2015), 2007 is a pre-election year, and certainly worth a closer look.
The chart below compares the S&P 500 of 2007 with the year-to-date S&P.
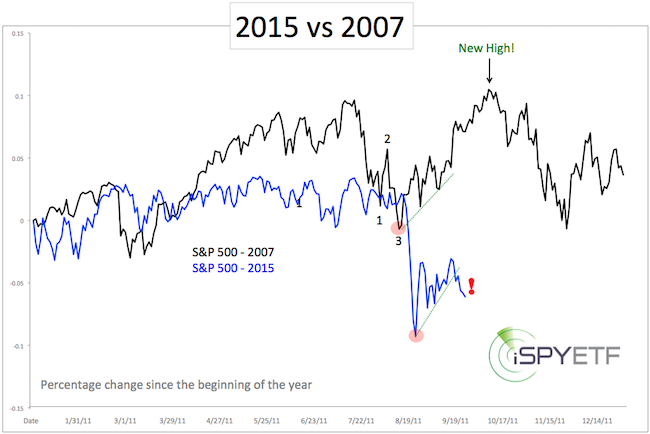
One of the most obvious similarities between the S&P 500 of 2007 and 2015 is a nasty 10% summer ‘haircut.’
The key feature of the 2007 summer drop is that trade recovered thereafter, and didn’t drop below the 2007 panic low (red circle).
If you enjoy quality, hand-crafted research, >> Sign up for the FREE iSPYETF Newsletter
The equivalent 2015 panic low is 1,867 for the S&P. Will this level hold?
Sunday’s (September 20) Profit Radar Report listed four reasons why 1,867 is likely to be tested or broken:
-
Seasonality. Bearish until mid-October
-
History: When August ended with a 5% loss, the following September was positive only 4 out of 13 times.
-
Triple Witching: Based on Friday's Triple Witching loss, there was a 72.3% chance stocks will be down this week.
-
2011 template.
Unlike 2007, the S&P broke the sequence of higher lows (dashed green lines) this week.
This doesn’t mean that the S&P cannot soar to new all-time highs, like it did in 2007. I think Q4 stock performance will be more positive than Wall Street expects, but the odds favor a new low (or test of prior low) before a more sustainable rally.
There are a number of open chart gaps at higher levels (SPY 195.21 and 199.28) which may get filled, so even a trip to new lows is unlikely to be a direct route.
How can we tell if an ensuing rally (when it materializes) has what it takes to move to new all-time highs?
The September 20 Profit Radar Report looked at all the facts, including an updated look at the ‘Secret Sauce’ major market top indicator.
A free look at the 'secret sauce' major market top indicator (the indicator that correctly foreshadowed the 1987, 2000 and 2007 top) is available here: Is the Bull Market Over?
Simon Maierhofer is the publisher of the Profit Radar Report. The Profit Radar Report presents complex market analysis (S&P 500, Dow Jones, gold, silver, euro and bonds) in an easy format. Technical analysis, sentiment indicators, seasonal patterns and common sense are all wrapped up into two or more easy-to-read weekly updates. All Profit Radar Report recommendations resulted in a 59.51% net gain in 2013 and 17.59% in 2014.
Follow Simon on Twitter @ iSPYETF or sign up for the FREE iSPYETF Newsletter to get actionable ETF trade ideas delivered for free.

If you enjoy quality, hand-crafted research, >> Sign up for the FREE iSPYETF Newsletter
|
