Massive. That’s the only way to describe The December 1 overnight reversal of the gold futures (following the Swiss no vote).
In fact, price action painted two giant green candles. One marked the November 7 low, and than there was Sunday’s.
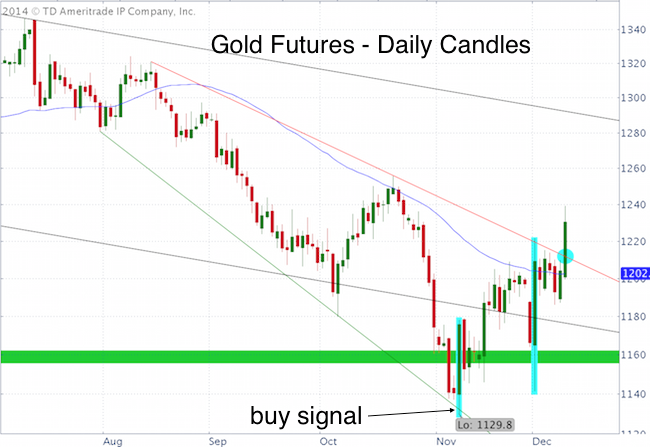
Two trading days before the November 7 low, the Profit Radar Report wrote: “There is a bullish divergence and gold has finally met our long-term down side target. Gold seasonality for November is bullish. Sentiment, seasonality and the bullish technical divergence increase the odds of an upcoming buying opportunity. We will dip our ‘toes in the water’ and buy gold if it dips below 1,130 and moves above 1,140.”
The Profit Radar Report identified the gold trade as one of the biggest opportunities around, and the gold rally was chugging along nicely, until the Swiss gold referendum came along.
Gold futures (chart shown) dropped more than 2% right after Sunday’s (November 30) rejection by Swiss voters. Sunday’s Profit Radar Report was published when futures were down more than 2%, trading near 1,145. It stated:
“Swiss voters rejected proposals Sunday to boost gold reserves. Short-term, the Swiss gold proposal was a lose/lose proposition for gold buyers and an unnecessary cross current for our precious metals trade. As Wednesday’s PRR mentioned, soaring prices following a ‘yes’ vote were a forgone conclusion. When everyone expects a rally, the market usually doesn’t deliver one. A ‘no’ vote on the other hand would obviously be bearish.
A quick drop in gold prices was needed to shock the ‘bullish Swiss vote gold bugs.’ The question is how long of a drop? Initial (kneejerk) reactions following such newsworthy events are often wrong. Gold futures are down another 2% on Sunday.
In terms of technical analysis, the most likely interpretation of this decline is a retracement of the rally from the November 7 low. The chart shows various Fibonacci retracement levels (78.6% = 1,146.70). In terms of Elliott Wave Theory, this pullback looks like a wave 2 correction. The only requirement for a wave 2 is that it can’t exceed the prior extreme (November 7 low). In short, as long as the November 7 low remains unbroken, we are looking for higher gold prices.”
The corresponding entry level for the SPDR Gold Shares ETF (NYSEArca: GLD) was at 111.08 on November 11.
Today, gold busted through red trend line resistance. This trend line can now be used as stop-loss.
What about Gold Miners?
Gold miners tend to respond faster and stronger to rising gold prices than bullion itself. In essence, gold miners are a leveraged play on gold prices.
Friday’s kneejerk reaction offered a low-risk entry for the MarketVectors Gold Miners ETF (NYSEArca: GDX).
Sometimes when a trend line is broken, prices will double back and test the line before peeling away in the direction of the break.
The Profit Radar Report suggested a buy limit order against the green trend line to scoop up GDX in case of a pullback. That’s exactly what happened November 28, courtesy of the kneejerk selloff prior to the Swiss vote.
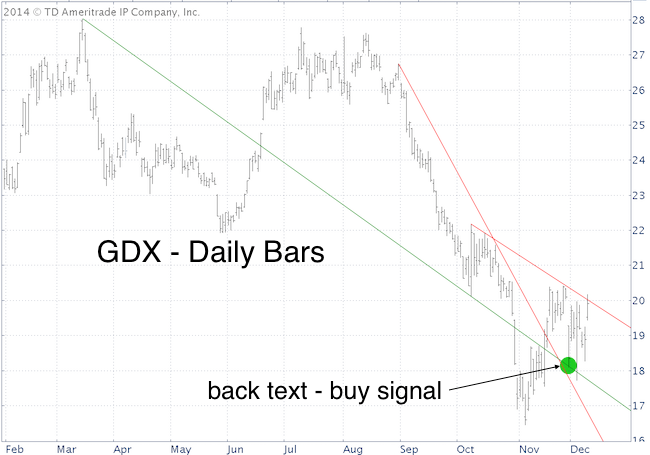
The actual GDX chart does not look as bullish as the gold chart, but GDX is likely to dance to gold’s beat, not vice versa.
The precious metals trade (which includes silver) is likely just in its infancy and should offer a number of good entry points along the way.
Continuous low-risk, high probability trading opportunities are available via the Profit Radar Report.
Simon Maierhofer is the publisher of the Profit Radar Report. The Profit Radar Report presents complex market analysis (S&P 500, Dow Jones, gold, silver, euro and bonds) in an easy format. Technical analysis, sentiment indicators, seasonal patterns and common sense are all wrapped up into two or more easy-to-read weekly updates. All Profit Radar Report recommendations resulted in a 59.51% net gain in 2013.
Follow Simon on Twitter @ iSPYETF to get actionable ETF trade ideas delivered for free.

|
