Apple is the most important stock on planet earth.
It’s the biggest component of the S&P 500 (NYSEArca: SPY) and Nasdaq (Nasdaq: QQQ). As of March 18, it will also be part of the Dow Jones, where it will rank as #6 of 30 (at least initially). Not bad for a “newcomer.”
The ebbs and flows of AAPL will affect almost every corner of the stock market universe.
When AAPL coughs, the market will get a cold. What are the odds of AAPL catching a cough?
Historical Dow Jones Curse
Historical data shows that inclusion into the prestigious Dow 30 club is more of a curse than blessing, at least short-term. 9 of the 15 components added since 1999 lost on average 6.3% within the first month.
Never Miss a Beat! >> Sign up for the FREE iSPYETF e-Newsletter
Technical Blessing?
I invite you to inspect the AAPL chart with me.
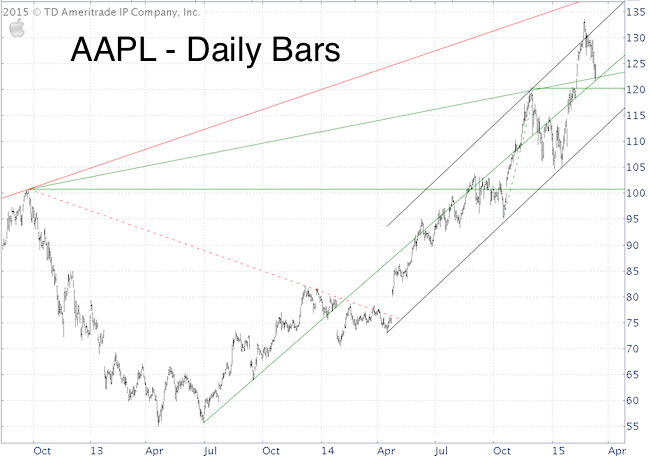
Support: Green lines at 120 – 122.
Resistance: The chart only shows one red line, but there are actually two red lines (one going back almost 20 years) converging around 140. Prior to that, there’s black trend channel resistance around 132.
Interpretation: Although the brief spike above the black trend channel (accompanied by a bearish RSI divergence) could be a throw over top, I personally favor higher prices as long as AAPL stays above 120.
This is in conflict with the ‘Dow curse,’ but in harmony with AAPL seasonality (view AAPL seasonality chart here).
Sentiment may also support further AAPL gains, as the iWatch failed to garner much excitement (it's easier to beat low expectations).
-
Bloomberg: Apple watch is a really poor product
-
MarketWatch: 3 reasons to think twice before buying Apple watch
Summary: Support at 120 – 122 deserves being watched closely. I favor further up side as long as support holds. However, a close below 120 cautions of a deeper correction.
Simon Maierhofer is the publisher of the Profit Radar Report. The Profit Radar Report presents complex market analysis (S&P 500, Dow Jones, gold, silver, euro and bonds) in an easy format. Technical analysis, sentiment indicators, seasonal patterns and common sense are all wrapped up into two or more easy-to-read weekly updates. All Profit Radar Report recommendations resulted in a 59.51% net gain in 2013 and 17.59% in 2014.
Follow Simon on Twitter @ iSPYETF or sign up for the FREE iSPYETF Newsletter to get actionable ETF trade ideas delivered for free.

|
