Perhaps the most fascinating chart right now is that of the NYSE Composite. It features two developments worth exploring:
-
Island reversal
-
Bearish wedge
The NYSE Composite includes all stocks listed on the NYSE, about 1,900. Unlike the S&P 500 (NYSEArca: SPY) or Dow Jones (NYSEArca: DIA), the NYSE Composite actually reached a new all-time high on Thursday.
The new all-time high was short-lived and followed by a massive gap down the next morning.
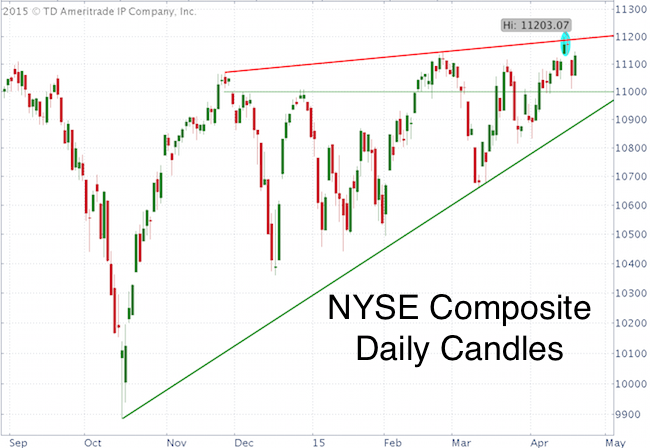
Island Reversal
This gap lower created an island reversal. Some analysts consider island reversals indicative of a major trend change, but the Technical Analysis book by Edwards and Magee describes it as follows:
“The island pattern is not in itself of major significance, in the sense of denoting a long-term top or bottom, but it does as a rule send prices back for a complete retracement of the minor move which preceded it.”
It’s probably up to debate where the last minor move started, but at Friday’s low the NYSE Composite already touched minor support.
In addition, as Sunday’s Profit Radar Report pointed out, there’s an open chart gap, and the post-2009 bull market has filled every chart gap.
Never Miss a Beat! >> Sign up for the FREE iSPYETF e-Newsletter
Open gaps are like unfinished business, and with the gap closed this morning, the NYSE Composite doesn’t ‘have to’ move any higher.
Bearish Wedge
In fact, the NYSE Composite has formed a potentially bearish wedge formation (bold trend lines). It takes a break below the green trend line to activate lower targets, but last weeks island reversal throw-over top may be an early indication of an upcoming correction.
Trade Setup
Last week’s all-time high is important for the short term, and going short against it presents a low-risk trade setup with a favorable risk/reward ratio.
Simon Maierhofer is the publisher of the Profit Radar Report. The Profit Radar Report presents complex market analysis (S&P 500, Dow Jones, gold, silver, euro and bonds) in an easy format. Technical analysis, sentiment indicators, seasonal patterns and common sense are all wrapped up into two or more easy-to-read weekly updates. All Profit Radar Report recommendations resulted in a 59.51% net gain in 2013 and 17.59% in 2014.
Follow Simon on Twitter @ iSPYETF or sign up for the FREE iSPYETF Newsletter to get actionable ETF trade ideas delivered for free.

Never Miss a Beat! >> Sign up for the FREE iSPYETF e-Newsletter
|
