|
|
| I Spy … A Weekly Red Candle S&P 500 High. Bearish? |
| By, Simon Maierhofer
|
| Monday March 02, 2015 |
|
|
|
|
| For the first time since December, the S&P 500 suffered a weekly red candle all-time high. The same thing happened nine times since October 2011. Here’s how the S&P 500 fared thereafter. |
|
The S&P 500 (NYSEArca: SPY) painted a weekly red candle following a new all-time high (ATH) for the first time since December.
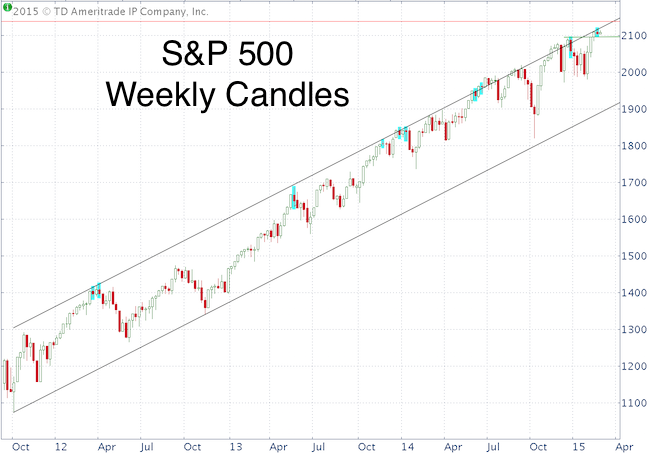
Should we be worried about this seemingly bearish red candle high?
Here is a bit of history: Since October 2011, the S&P 500 suffered similar red candle ATHs nine times (see blue boxes).
Looking for more stock market analysis? >> Sign up for the FREE iSPYETF e-Newsletter
Four were reversed immediately, four of them led to noteworthy selloffs (more than 100 points from the ATH) and one resulted in a 50-point pullback.
Based on recent history, last week’s red candle ATH in itself doesn’t spell trouble. Important support is around 2,090. This support may be tested, but it will take sustained trade below to knock the bulls of the throne (temporarily).
Simon Maierhofer is the publisher of the Profit Radar Report. The Profit Radar Report presents complex market analysis (S&P 500, Dow Jones, gold, silver, euro and bonds) in an easy format. Technical analysis, sentiment indicators, seasonal patterns and common sense are all wrapped up into two or more easy-to-read weekly updates. All Profit Radar Report recommendations resulted in a 59.51% net gain in 2013 and 17.59% in 2014.
Follow Simon on Twitter @ iSPYETF or sign up for the FREE iSPYETF Newsletter to get actionable ETF trade ideas delivered for free.

|
|
|
|
|
|
|
|
|
|
|
|
|
|
