The 30-day VIX (VIX) is trading 23% lower than the 90-day VIX (VXV). This means VIX traders are less concerned about shorter-term (30-day) volatility than longer-term (90-day) volatility.
You may be thinking short-term complacency is a contrarian indicator … and you are right.
To provide a visual of short-term complacency, I’ve calculated the ratio between VIX and VXV and plotted it against the S&P 500.
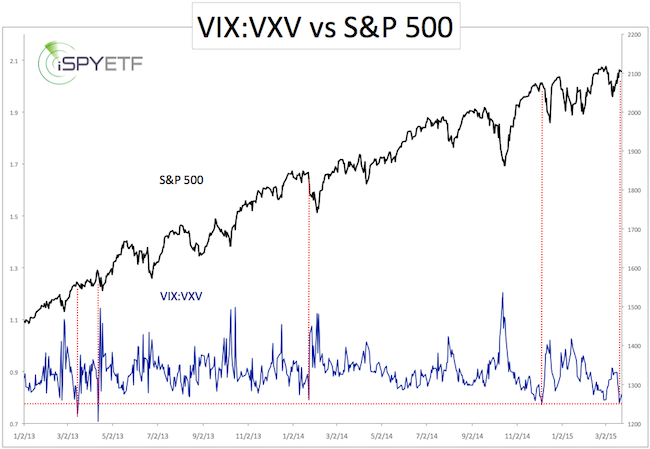
For only the second time since April 2013, the VIX:VXV ratio dropped below 0.78 (view a long-term version of the VIX:VXV ratio chart here)
Prior sub 0.79 readings are highlighted with a dashed red line.
Never Miss a Beat! >> Sign up for the FREE iSPYETF e-Newsletter
The conclusion is more or less self-explanatory.
This indicator has a pretty good track record and increases the odds of a S&P 500 (NYSEArca: SPY) pullback and VIX rise. Long VIX ETFs include the iPath S&P 500 Short-term VIX Futures ETN (NYSEArca: VXX) and VelocityShares Daily 2X ST VIX ETN (NYSEArca: TVIX).
Two things to keep in mind:
-
This is likely to be a short-term (3 - 10 days) trade.
-
In terms of risk management; a VIX close below support at 12.70 would temporarily (as long as it stays below 12.70) suspend the potential for a spike.
Simon Maierhofer is the publisher of the Profit Radar Report. The Profit Radar Report presents complex market analysis (S&P 500, Dow Jones, gold, silver, euro and bonds) in an easy format. Technical analysis, sentiment indicators, seasonal patterns and common sense are all wrapped up into two or more easy-to-read weekly updates. All Profit Radar Report recommendations resulted in a 59.51% net gain in 2013 and 17.59% in 2014.
Follow Simon on Twitter @ iSPYETF or sign up for the FREE iSPYETF Newsletter to get actionable ETF trade ideas delivered for free.

|
