I’m a big fan of ETFs, but when analyzing an asset class, the analysis should be based on the purest representation of that asset class.
A number of technical analysts spotted a bullish TLT breakout on March 27. TLT is the iShares 20+ Year Treasury ETF (NYSEArca: TLT).
On March 28 I published the article “Beware of False TLT Treasury ETF Breakout and S&P 500 Breakdown.”
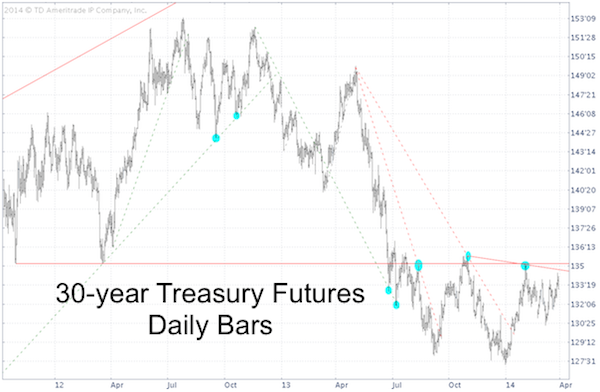
TLT’s breakout appeared like a ‘fake out break out’ because the 30-year Treasury Futures (ZB), a purer representation of Treasuries, didn’t confirm the breakout.
The first two charts below (featured in the March 28 article) show the discrepancy between TLT and ZB.
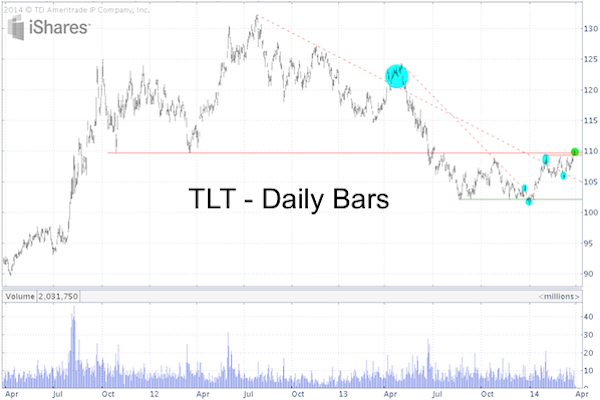
In short, TLT is above resistance (green bubble), ZB is well below important double resistance.
The performance of 30-year Treasuries can be a powerful tell tale sign, as Treasuries often move in the opposite direction of the S&P 500 (SNP: ^GSPC).
A Treasury breakout would likely have coincided with an S&P 500 breakdown.
The third chart zooms in on 30-year Treasury futures (ZB) and highlights the performance since March 28 in blue.
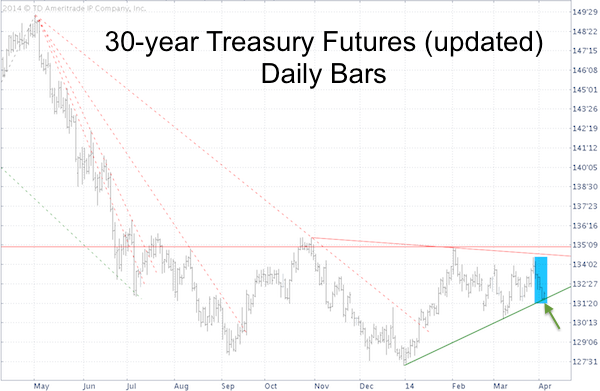
We see that ZB was rejected by resistance, but more importantly, ZB is now trading right on top of short-term green trend line support (green arrow).
This means that it will probably takes a drop below support to unlock lower prices for ZB and higher prices for the S&P 500.
Just like 30-year Treasuries have found support, the S&P 500 is dealing with key resistance.
This S&P 500 resistance is revealed here and may well change the way you look at the S&P 500:
S&P 500 – Stuck Between Triple Top and Triple Bottom – What’s Next? (Article #4)
Simon Maierhofer is the publisher of the Profit Radar Report. The Profit Radar Report presents complex market analysis (S&P 500, Dow Jones, gold, silver, euro and bonds) in an easy format. Technical analysis, sentiment indicators, seasonal patterns and common sense are all wrapped up into two or more easy-to-read weekly updates. All Profit Radar Report recommendations resulted in a 59.51% net gain in 2013.
Follow Simon on Twitter @ iSPYETF or sign up for the FREE iSPYETF Newsletter to get actionable ETF trade ideas delivered for free.

|
