As many of you already know, my “3 Pillars of Market Forecasting” are:
-
Technical Analysis
-
Sentiment Analysis
-
Seasonality & Cycles
In terms of seasonality, there are basically two times of the year that tend to be pivotal for the S&P 500 (SNP: ^GSPC): April/May and September/October.
September/October often sees market lows, and/or the beginning of bullish seasonality (such as 2011, 2012, 2013).
April/May often sees market tops, and/or the beginning of corrections (such as 2011, 2012, 2013).
Midterm presidential election year Aprils tend to be even more potent.
The chart below (originally published in the March 30 Profit Radar Report) plots the S&P 500 YTD against S&P 500 midterm seasonality (based on every midterm year since 1950).
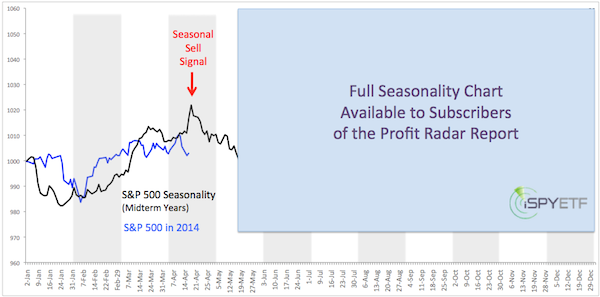
On average, the S&P 500 (NYSEArca: SPY) starts getting into trouble around mid-April (full seasonality charts, including overall seasonality and midterm seasonality with democratic president is available to subscribers of the Profit Radar Report).
What makes April 2014 even more precarious is that MACD just triggered a sell signal (signals are stronger when technical analysis confirms seasonal patterns).
This sell signal is loaded with tell tale signs. More details are available here:
MACD Triggers the Year's Most Infamous Sell Signal
Simon Maierhofer is the publisher of the Profit Radar Report. The Profit Radar Report presents complex market analysis (S&P 500, Dow Jones, gold, silver, euro and bonds) in an easy format. Technical analysis, sentiment indicators, seasonal patterns and common sense are all wrapped up into two or more easy-to-read weekly updates. All Profit Radar Report recommendations resulted in a 59.51% net gain in 2013.
Follow Simon on Twitter @ iSPYETF or sign up for the FREE iSPYETF Newsletter to get actionable ETF trade ideas delivered for free.

|
