Ok, it may be a bit too premature to talk about the year-end rally, but retailers plan early for Halloween and Christmas, why shouldn’t investors look a few months ahead?
There actually is one strong technical indication that stocks have put in a bottom and are getting ready to move higher for a while.
First off, the S&P 500 (NYSEArca: SPY) and Nasdaq-100 (Nasdaq: QQQ) have not yet reached their ideal up side target (target levels available to subscribers of the Profit Radar Report).
That’s unfinished business on their to-do list and based on Thursday’s strong bounce, the Nasdaq and S&P seem intent to put a check mark behind those to-do items.
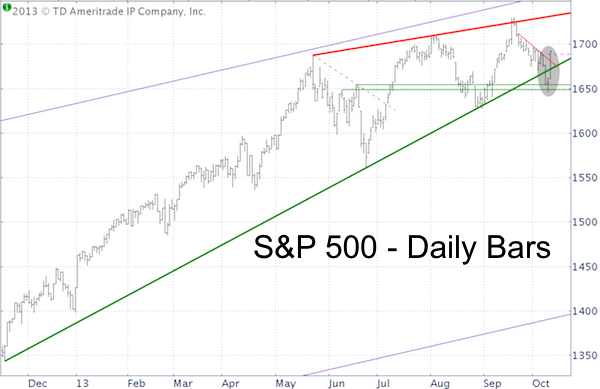
The short-term key to a bullish outcome is the green trend line shown in the S&P 500 (SNP: ^GSPC) chart below.

At first glance, the green trend line seems like a natural border between the bull and bear case. There used to be a time when trend lines like this worked like a charm. But the market’s character changed in 2011. Since then the S&P 500 has broken similar trend lines various times and recovered every time.
The green trend line just got violated, is it still valid? Yes, especially so.
Allow me to use this excerpt from the October 7 Profit Radar Report to explain why this is good news for bulls (this is one of the rare times we publish a large section of the Profit Radar Report for free):
Why We Were Looking for a ‘Broken’ Trend Line
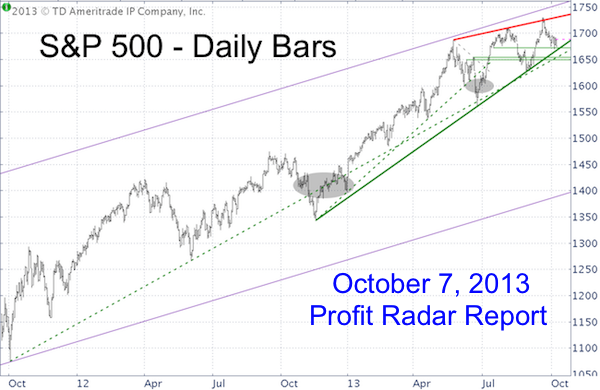
“At first glance, the green trend line seems like a natural border between the bull and bear case. There used to be a time when trend lines like this worked like a charm. But the market’s character changed in 2011. Since then the S&P 500 has broken similar trend lines various times and recovered every time.
In 2012 and earlier in 2013 we successfully adjusted our strategy and waited for a drop below trend line support followed by a move back above to go long. The longer-term chart with additional trend lines shows that prior trend line breaks weren’t fatal (gray ovals).

Therefore going short against trend line resistance bears risks, especially since there are still unfulfilled up side targets (discussed in yesterday’s PRR) and an open chart gap (1,688) left by this mornings down open.
The main reason to search for a short entry point is that we do not want to miss out on a potentially sizeable decline. Bold green trend line support is at 1,668 tomorrow. A drop below 1,668 is not necessarily a sell signal. However, due to the potential for a larger decline, we will go short if the S&P drops below 1,665 (a 3-point seesaw buffer zone) and a stop-loss at 1,675.
The scenario that appears to make most sense is a quick trip into the 1,660s or 1,650s followed by another rally to new all-time highs. We will therefore lower our stop-loss to virtually guarantee a winning trade.”
The S&P 500 (NYSEArca: IVV) followed our script pretty closely and based on similar technical patterns in 2012 and 2013, odds favor higher prices. Any trade below the green trend line and the trade is off. The up side target for this rally is available to subscribers of the Profit Radar Report.
There are two other variables that help assess the viability and longevity of an upcoming rally.
1) Viability of the rally: The VIX (Chicago Options: ^VIX) is about to a major seasonal turning point. Fore more information about VIX seasonality and the most unique VIX seasonality chart click here: VIX Seasonality Near Best Turning Point of the Year
2) Longevity of the rally: The S&P 500 has been closely following a 13-year and 7-year top and bottom cycle since the 1970. Both cycles will meet this and next year for a potent signal. For a detailed analysis of the S&P 500 cycles click here: S&P 500 Cycle Analysis
Simon Maierhofer is the publisher of the Profit Radar Report.
Follow Simon on Twitter @ iSPYETF or sign up for the FREE Newsletter.

|