In early November, gold finally reached my down side target and I became a self-proclaimed gold bull, at least for 2015.
After over three years of falling prices (from 1,927 to 1,130) it just felt right to put the bear down for its hibernation and become a bull. In November 2014, at the 1,130 low, the pieces were in place for at least a tradable and perhaps a lasting low:
-
Gold reached my down side target
-
There was a bullish RSI divergence
-
There was a big green reversal candle at the November 7 low
-
Seasonality was turning temporarily bullish
-
Sentiment was ripe for a reversal. The ‘smart money’ was bullish and the ‘dumb money’ was bearish
On queue, gold started cruising higher and everything went according to plan … until something odd happened in late January.
Don't Miss Another Seasonal or Sentiment Sell Signal >> Sign up for the FREE iSPYETF Newsletter
The January 27 Profit Radar Report noted that commercial traders (smart money) were selling gold at a rapid pace, and published the chart below. The dashed red lines illustrate what happened the last two times commercial traders fled gold.
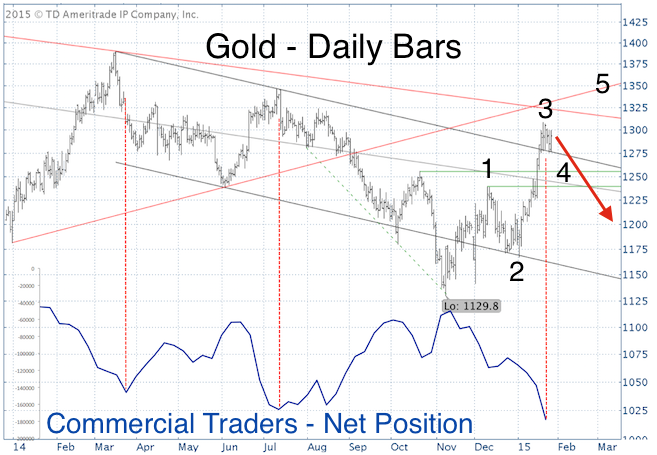
The chart also included Elliott Wave labels (numbers from 1 – 5). In case you’re not familiar with Elliott Wave Theory, you may find this excerpt from the same Profit Radar Report interesting:
“The chart shows that current trade is important from an Elliot Wave perspective. Gold appears to have completed a 3 wave rally. There are now two options:
-
Gold will trace out a wave 4 correction followed by wave 5 higher. Target for a wave 5 high is around 1,330.
Longer-term, a complete 5-wave rally will be followed by a corrective decline and at least one more rally leg.
Shorter-term, a wave 4 correction could become a pain to manage. Waves 4 tend to seesaw over support/resistance levels, therefore using the trend channel support at 1,275 as stop loss could kick us out at the wrong time.
-
A 3-wave rally is indicative of a correction and would translate into a relapse to new lows. This option is unlikely, but theoretically possible.”
Balancing the potential of long-term gains and short-term risk was a tough call, but my recommendation was as follows:
“We can either take our profits and run or commit to endure a potentially painful correction in exchange for further gains. I like to keep things simple and recommend taking profits. Lets cash in gold around 1,295 and GLD around 124.20 for a nice 13.5% gain.”
In addition to bearish sentiment developments, the Profit Radar Report cautioned of weak gold seasonality. The chart below plots the actual price of the SPDR Gold Shares ETF (NYSEArca: GLD) against gold seasonality up until mid-March (a full year gold seasonality chart is available to subscribers of the Profit Radar Report).
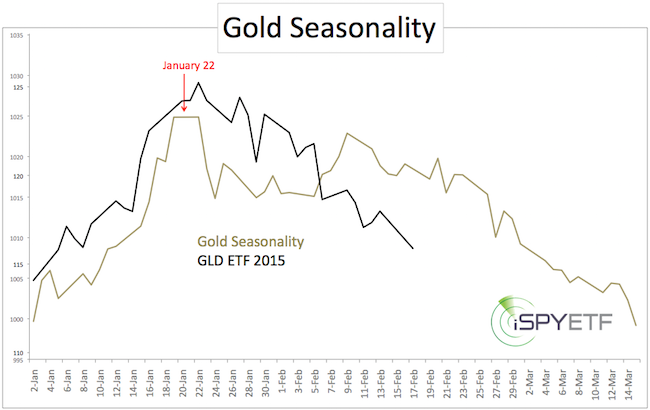
It’s hard to ignore the textbook November bottom, but it’s also hard to ignore the January sentiment and seasonality warnings. The risk of more down side is real, and my inner gold bull is set on hibernation mode for now. As per the second Elliott Wave Theory option discussed above, new lows are at least possible.
Simon Maierhofer is the publisher of the Profit Radar Report. The Profit Radar Report presents complex market analysis (S&P 500, Dow Jones, gold, silver, euro and bonds) in an easy format. Technical analysis, sentiment indicators, seasonal patterns and common sense are all wrapped up into two or more easy-to-read weekly updates. All Profit Radar Report recommendations resulted in a 59.51% net gain in 2013 and 17.59% in 2014.
Follow Simon on Twitter @ iSPYETF or sign up for the FREE iSPYETF Newsletter to get actionable ETF trade ideas delivered for free.

|
