On June 8, Barron’s reported that the gold speculators are back and the Financial Times observed that gold bulls feel no need to hedge their gold position.
On June 11, MarketWatch ran an article titled: “Why mining stocks point to gains for gold prices”.
On June 14, gold prices (and gold ETFs) fell 45 points or 3.5%.
What happened?
Gold ran into a triple barrier.
That triple barrier is made up of:
-
Technical resistance
-
A seasonal weak spot
-
Bullish sentiment extremes
The July 13 Profit Radar Report pointed out that: “Gold is making progress towards our up side target. We are considering a small short position.”
What was the up side target and how was it determined?
The up side target was 1,350, determined by combining technical analysis, seasonality and sentiment.
The June 1 Profit Radar Report published this price projection (chart below, yellow lines) and stated:
“On Friday gold slipped into our support zone at 1,255 – 1,230. Gold sentiment is quite bearish, so the immediate down side may be limited. The yellow projection shows one possible route to get to 1,350+/-.”
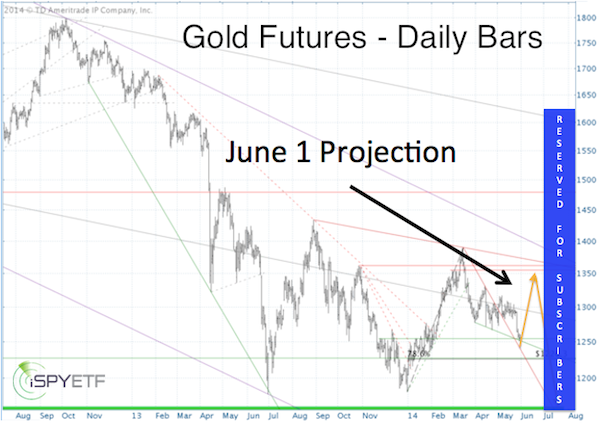
In terms of time, the projection was off by a couple of weeks, but gold reversed rather violently when it neared the outlined cluster of technical resistance levels around 1,350. Since prices did not completely touch the resistance cluster, there is still a chance of another bounce to 'complete unfinished business.'
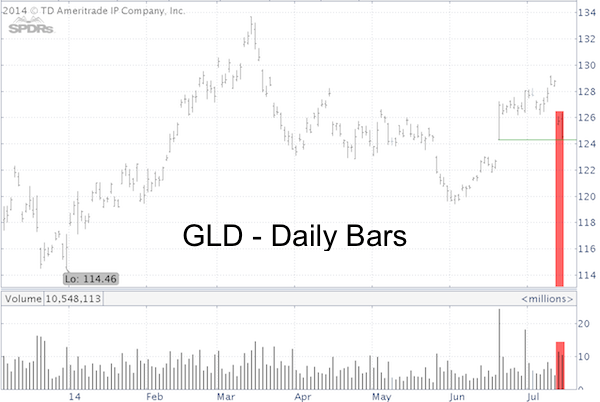
The SPDR Gold Shares ETF (NYSEArca: GLD) chart below offers an updated look at the gold market, with some interesting technical nuggets.
-
GLD (and IAU) found support right at the June 19 gap up open. I’m showing the GLD chart, because this gap is not visible on the futures chart. The iShares Gold Trust (NYSEArca: IAU) paints a similar picture. Gold (and GLD) should bounce as long as this support holds.
-
GLD (and IAU) is trading heavy, as trading volume over the last few days was elevated. A close below 124.30 would likely trigger another step down.
How much more down side potential is there?
A close look at the long exposure of commercial traders (which includes actual gold miners, considered the ‘smart money’) shows how they feel and what it may mean for gold prices.
Smart Money is Leaving Gold Just as the ‘Herd’ is Jumping in
Simon Maierhofer is the publisher of the Profit Radar Report. The Profit Radar Report presents complex market analysis (S&P 500, Dow Jones, gold, silver, euro and bonds) in an easy format. Technical analysis, sentiment indicators, seasonal patterns and common sense are all wrapped up into two or more easy-to-read weekly updates. All Profit Radar Report recommendations resulted in a 59.51% net gain in 2013.
Follow Simon on Twitter @ iSPYETF or sign up for the FREE iSPYETF Newsletter to get actionable ETF trade ideas delivered for free.

|
