Wall Street is grappling for reasons to explain gold’s biggest decline since 1980. Here are some alleged reasons:
-
Federal Reserve may consider withdrawing QE sooner than expected
-
Investors selling gold to pay for taxes (April 15 tax dead line)
-
Easy come, easy go: Gold ETFs like the SPDR Gold Shares (GLD) made buying gold easier than ever. Now gold ETFs accelerate falling prices
-
Computer and high frequency trading
-
Panic selling, margin calls
-
Falling demand from China and India
The fundamental factors mentioned above ultimately affect supply and demand. The forces of supply and demand drive the price of gold. The price of gold is reflected on a chart.
By default a chart reveals more pertinent information than any piece of fundamental analysis. What did the gold chart say before the meltdown?
An Ironic Safety Net
Ironically, I’ve been looking for an opportunity to buy gold, but the gold chart refused to trigger a solid buy signal.
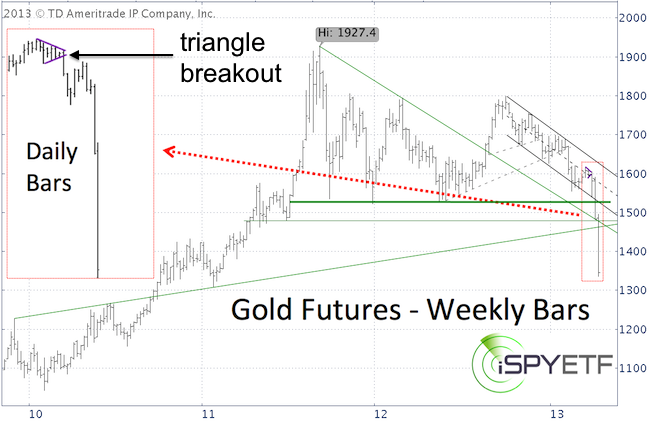
On February 21, gold prices fell as low as 1,554 and the Profit Radar Report doubted that this low was for real: “Longer lasting bottoms generally see a more visible bullish RSI divergence. I would like to see a lower low in a week or two to firm up the idea of a larger bottom.”
Gold prices rallied modestly thereafter, but formed a bearish triangle (purple lines on chart below) and the Profit Radar Report warned that: “A move/close below 1,596 may drive prices below 1,554.”
In hindsight we know that a target below 1,554 was a gross under estimation, but still it kept us out of gold.
The March 31, Profit Radar Report laid out all the key factors affecting gold:
“Here's the rub on gold: We should eventually (April/May) see a good buy signal. Ideally, gold will drop below 1,554 first. Well-defined and much publicized support is around 1,520. The media has been talking so much about support around 1,520 that we have to expect some sort of fake out move.
This could be a bottom above support or stop-running with a temporary drop below support (the risk is that a drop below support could trigger a quick avalanche of selling).
Either way, added volatility may make it tough to manage positions effectively with stop-loss orders. The bottom line is that we'll be looking for a low-risk opportunity to go long eventually.
A move below 1,522 followed by a close back above would be a buy signal. A move below 1,554 with a positive RSI divergence could be a tentative buy signal.
Prices hit an air pocket and gold’s meltdown will enter the history books as the biggest decline since 1980. But what caused the free fall?
It may have been caused by any of the bullet points above. We’ll never know, but we do know that the chart continuously warned of lower prices.
The move below 1,596 suggested lower prices and the drop below 1,520 and 1,480 pointed to an acceleration of the sell off. This is a terrible situation for gold investors.
But anyone who stayed away from gold (or even went short at 1,596) will be able to pick up gold at deeply discounted prices, eventually.
My technicals suggest that gold hasn’t bottomed yet. There may be a bounce, but it will take a new low against support with a bullish price/RSI divergence or a move back above resistance to trigger a buy signal.
The Profit Radar Report provides continuous gold analysis along with key support/resistance levels and buy/sell triggers.
|
