I was going to start this article out with a bunch of sobering stats … but decided to go with a cartoon instead. A few pen strokes by a capable artist may explain the situation better than an avalanche of numbers. Here it is:

We are all familiar with the term “house of cards” and its implication. For illustration purposes, let’s assume we’re dealing with a number of card houses. What’s curious is that most of them are falling apart while one of them is still standing.
This house of cards is not separated from the others or protected by a draft, but it keeps standing as if it’s best buds with a glue gun.
It’s The Glue Gun
It’s amazing what can be fixed with a glue gun. My wife’s favorite “household appliance” is her trusted glue gun. It comes out whenever something’s on the fritz or “beyond fritzed.”
My wife isn’t the only one to like her glue gun, central banks around the world, particularly the Federal Reserve and European Central Bank (ECB), love their (glue) guns and they’re sticking to them.
In fact, their glue gun – printing money – has become a sort of addiction. Without “sniffing glue,” the economies just can’t survive. How do we know that?
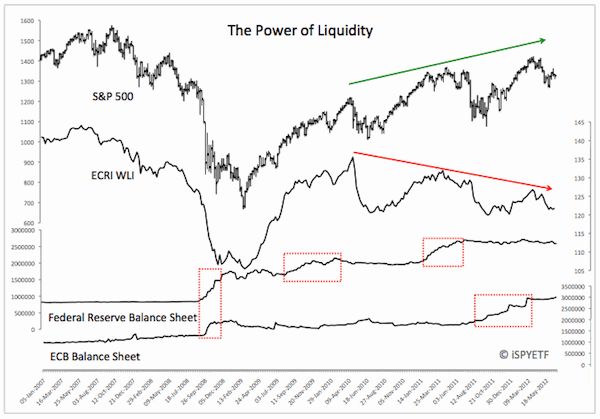
Now would be a good time to pull out some charts and data. The chart below compares the performance of the S&P 500 (SPY) with economic activity and the balance sheets of the Federal Reserve and ECB.
Rather than listing economic activity individually, the chart shows the Weekly Leading Index (WLI) published by the Economic Cycle Research Institute (ECRI).
The ECRI WLI is a proprietary index that combines multiple data points including unemployment, CPI, PPI, mortgage applications, etc.

The chart is almost self-explanatory, but let’s just highlight the obvious anomalies.
The S&P has been going up (green arrow). The ECRI WLI – meaning broad economic activity – has been going down. Why?
The balance sheets (glue guns) of the Federal Reserve and ECB glued the system together when it was falling apart. The ECB’s liabilities are close to $4 trillion, the Federal Reserves’ about $2.6 trillion.
The stock market thus far is enamored by the glue gun approach, but the economy’s saying that the glue gun isn’t working. Something’s gotta give. I think it will be the stock market.
|