“Sell in May and Go Away”
Will the most chewed-out adage on Wall Street be a fact or farce in 2014?
Like me, you probably have a vested interest in getting the whole ‘sell in May’ business right (my vested interest is explained below).
The S&P 500 (SNP: ^GSPC) chart below marks every May 1 (or first trading day in May) since 2009.
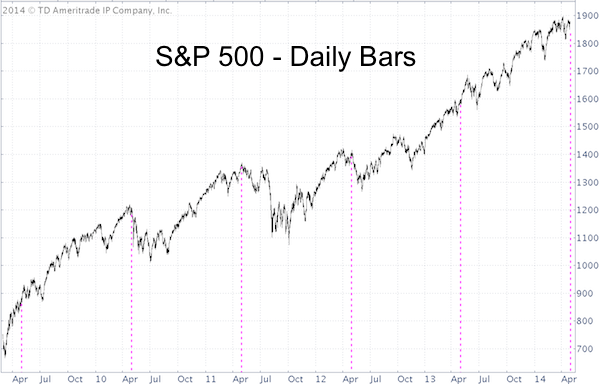
Historically, ‘sell in May and go away’ is right many more times than it is wrong.
But, I am a contrarian investor and always suspicious of the ‘trade most traveled.’
The crowded trade generally turns from bliss to blister in a hurry.
Is the ‘Sell in May’ Trade (too) Crowded Right Now?
On Monday a prominently featured strategist proclaimed and explained: “Why the sell in May adage makes sense this year,” and a Barron’s article asked: “Sell in May and go away?” (the answer was ‘yes’).
It seems like the media is conditioning investors to sell in May. The masses are rarely right, so the market may decide to deliver a curveball.
This in turn would be unfortunate, because my 2014 Forecast (published on January 15, 2014) proposed a larger correction to start in April or May.
Below is an excerpt from my S&P 500 2014 Forecast (see image).

The S&P 500 (NYSEArca: SPY) has adhered to its historic seasonality pattern fairly closely. As proposed, seasonality limited the February correction to 1,746 – 1,730 and pushed the S&P to new all-time highs in April.
The S&P has tracked the 2014 Forecast beautifully, but the increased coverage of the ‘sell in May’ pattern is turning the 2014 Forecast into a crowded trade.
Now I’m Part of the Problem
It gets worse. On Monday, Investor’s Business Daily (IBD) asked me for an updated 2014 outlook.
Good news: IBD published my outlook (Excerpt: “The stock market tends to be weak from April to June in midterm election years” – click here for full IBD S&P 500 forecast article).
Bad news: The actual headline of the IBD article: “Why Investors Expect To Sell In May And Go Away.”
Am I Digging My Own Outlook’s Grave?
After re-examining various indicators, the weight of evidence still suggests an April/May/June correction.
The S&P 500 seasonality chart of midterm election years emphasizes a deeply bearish bias (click here for the only free and updated S&P 500 seasonality chart: S&P 500 seasonality chart), which by the way started already in April.
However, the market will be trying to trick investors that jump on this probably crowded trade. This could be in the form of a delayed correction, a shallow correction, or a fake out rally (bull trap).
My latest S&P 500 outlook, along with key support/resistance levels and low-risk buy/sell triggers is available via the Profit Radar Report.
Simon Maierhofer is the publisher of the Profit Radar Report. The Profit Radar Report presents complex market analysis (S&P 500, Dow Jones, gold, silver, euro and bonds) in an easy format. Technical analysis, sentiment indicators, seasonal patterns and common sense are all wrapped up into two or more easy-to-read weekly updates. All Profit Radar Report recommendations resulted in a 59.51% net gain in 2013.
Follow Simon on Twitter @ iSPYETF or sign up for the FREE iSPYETF Newsletter to get actionable ETF trade ideas delivered for free.

|
