If you have skin in the game, you probably know something about the game.
If you have money invested in stocks, you probably have noticed the increasingly bullish forecasts.
Sentiment is a valuable contrarian indicator, but exact danger levels are difficult to quantify. How worrisome is the current bullishness?
Inverse Contrarianism
We saw a rare phenomenon in early January. Investors turned bullish, but the media publicized the bearish implications of bullish investors.
The January 13, Profit Radar Report pointed out the following: “Last week’s most notable development is the uptick in investor optimism. This normally contrarian development is tapered by the unusual media attention.
A headline on the Yahoo!Finance homepage reads: ‘Is the crowd’s cheery mood reason to fear the rally’s end?’ CNBC published articles such as: ‘Why the VIX’s recent plunge may be bad for stocks’ and ‘Where is the wall of worry?’
A contrarian indicator with so much mainstream attention is not contrarian anymore. Hopefully a continued move (perhaps through a laborious process) to around 1,490 will silence the contrarian publicity and better align overall sentiment with our upcoming technical short setup.
Market Silenced the Media
The S&P 500 has rallied 40 points since mid-January and did indeed silence suspicious media outlets.
Now we see headlines like these:
CNBC: Market Bears on The Brink: ‘I Can’t Fight Anymore’
CNBC: S&P 1,500: Last Barrier Before New Record
Reuters: The Great Rotation: A Flight to Equities in 2013
Bloomberg: Nouriel Roubini Faces the Music: Did Dr. Doom get it Wrong?
This is the most bullish I’ve seen the media in well over a year, but admittedly my self-composed “Headline Sentiment Index” lacks the trackability needed for a good indicator.
Other sentiment gauges do have a long track record and the Profit Radar Report takes a detailed look at four of them every month.
Below is the January 2013 Sentiment Picture (the Profit Radar Report prepares one detailed Sentiment Picture per month for subscribers on record).
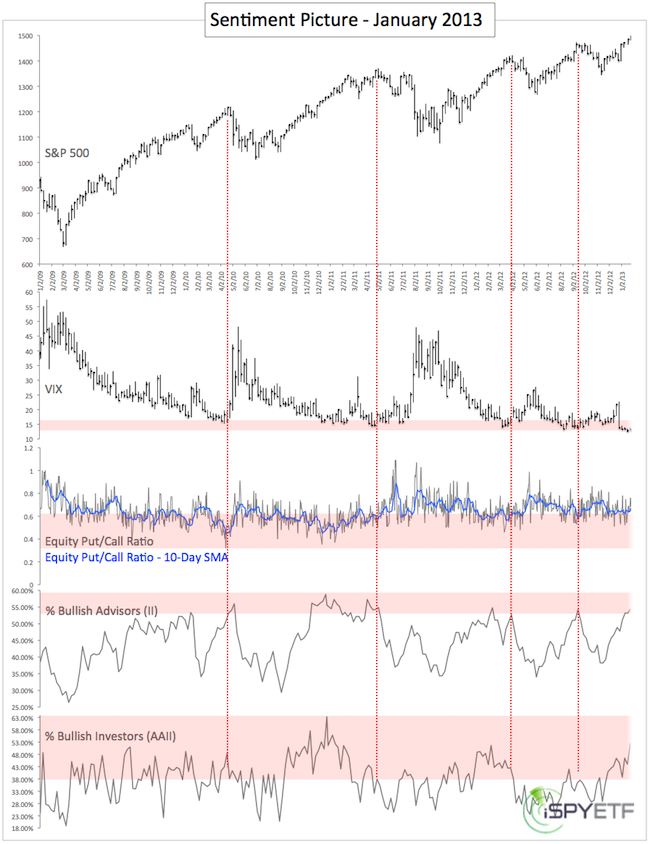
Like gauges in your car’s instrument cluster, the monthly Sentiment Picture provides a quick summary of what’s going on.
Illustrated are the CBOE Volatility Index (VIX), Equity Put/Call Ratio, the percentage of bullish advisors/investors polled by Investors Intelligence (II), and the American Association for Individual Investors (AAII).
Shaded red areas denote the minimum/maximum sentiment extremes seen at prior highs.
Here’s a quick rundown of the four indicators:
The VIX is in danger territory (red box).
The Equity Put/Call Ratio is not per say in danger territory, but not far away from where a market top could be.
The percentage of bullish advisers polled by II is getting in the red danger zone.
The percentage of bullish investors polled by AAII is in the red zone.
Summary
Investor enthusiasm is high enough to where it could cause a sizeable correction, but not extreme enough to force a turnaround. A break below support would probably elicit more selling.
And one thing is for sure, there are plenty of buyers that could turn into sellers and drive prices lower. The Profit Radar Report pinpoints the support levels that, once broken, will cause more selling.
|
