If you don’t open your eyes to the bigger picture, you open your portfolio to unnecessary losses.
CNBC’s countdown clock will tell you that the Dow is only X points away from its 2007 all-time high. That’s true, but it’s also deceptive.
The Dow Jones Industrial Average is a price-weighted average of only 30 large cap stocks. IBM alone accounts for over 11% of the Dow’s movements.
The S&P 500 is a market capitalization weighted index of 500 large cap stocks that emphasizes the performance of the largest of large caps.
Mega Cap, ‘Mini’ Performance
Fact is that the bluest of the large cap stocks are lagging compared to the rest of the market. IBM is 5% from its all-time high as is Exxon Mobil. Oh yes, there’s also Apple, key player of the S&P 500, trading 36% below its high watermark.
A simple chart illustrates the ‘weakness’ of mega cap stocks compared to their large cap cousins. Figure 1 provides a visual comparison of the S&P 500 SPDR (SPY) and an equal weight S&P 500 ETF (Guggenheim S&P 500 Equal Weight ETF – RSP).
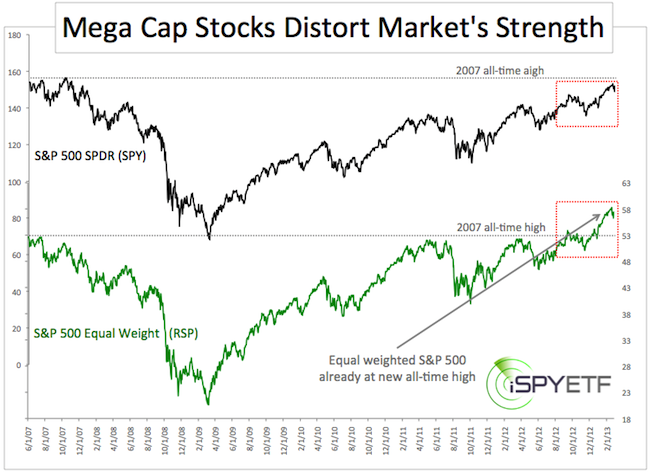
SPY trades about 3% below its 2007 high, equal weighted RSP trades more than 7% above its 2007 high. Why?
The top five S&P 500 components (Apple, Exxon Mobil, GE, Chevron, IBM) account for 11% of the index. Four of the top five holdings are more than 5% from their all-time highs.
The top five equal weight S&P 500 components account for 1% of the equal weight index and allow ‘smaller larger’ caps to pick up the slack of mega caps.
‘Smaller is Bigger’
Smaller is better in this QE bull market (more below). Mega caps underperform large caps, and large caps under perform small and mid-cap stocks.
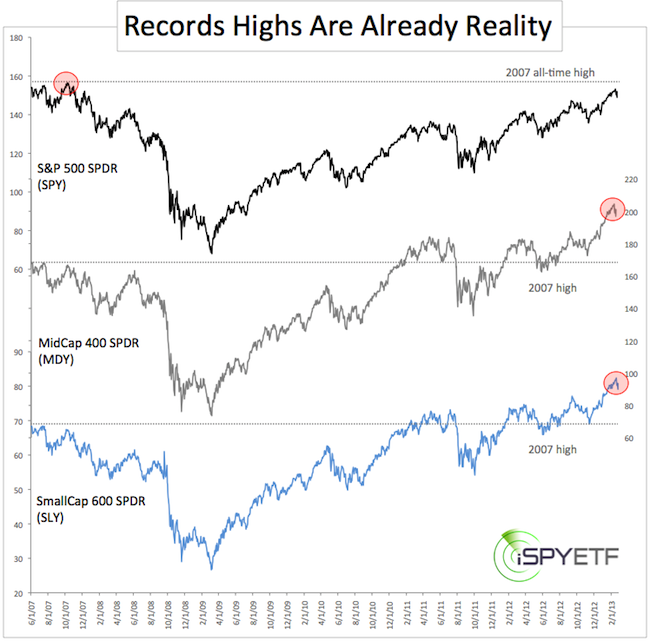
Figure 2 plots the S&P 500 SPDR (SPY) against the MidCap 400 SPDR ETF (MDY) and SmallCap 600 SPDR ETF (SLY). The message is the same. MDY and SLY are at new highs, SPY isn’t.
What’s the Big Deal?
Stocks are up, portfolios are up, Wall Street is happy and the media is ecstatic, so what difference does it make who or what performs best?
Market tops are liquidity events. When investors stop buying, stocks start falling. Small and mid-cap stocks dry up first as they are most sensitive to liquidity squeezes.
That’s why small and mid-cap stocks tend to underperform somewhat going into larger scale highs. Thanks to the Fed’s artificial liquidity environment that hasn’t been the case.
Based on the strong showing of small and mid cap stocks and the absence of bearish divergences, the Profit Radar Report was expecting new highs even when the S&P traded well below 1,400 in November of last year.
Historic money flow patterns suggests that the overall trend remains up as long as small and mid cap stocks keep up with large caps.
|
