What goes up must come down. We’re all aware of this fact of life. The question is, when will stocks come down and how fast and far will they come down?
There’s been some talk about another Flash Crash event, so I wanted to check out how likely another Flash Crash-like event is right now.
The price action leading up to the May 6, 2010 Flash Crash is illustrated in the first chart below.
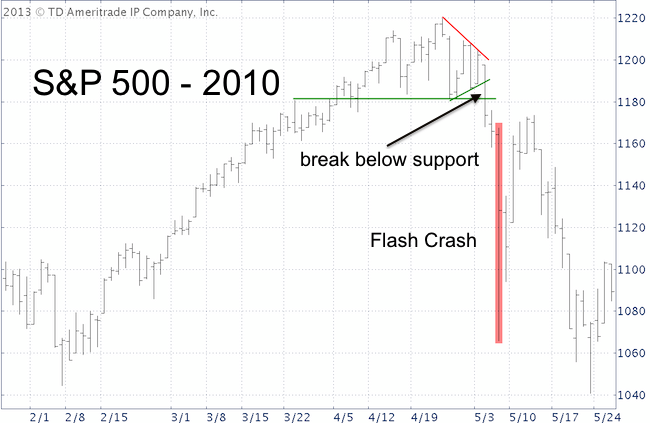
Note that the ominous May 6 sell off happened eight trading days after the April 26 high. By the time May 6 rolled around, the S&P 500 had broken below two support levels (green lines). It also broke out of a triangle formation.
The basic recipe of events (time lag between top and waterfall decline, break below support levels) also led up to Black Monday, the fateful day that saw stocks crash in 1987.
Another clue leading up to the 2010 high was an extremely low equity put/call ratio. In a note to subscribers on April 16, I warned of the following:
“The message conveyed by the composite bullishness is unmistakably bearish. The put/call ratio in particular can have far reaching consequences. Protective put-buying provides a safety net for investors. If prices fall, the value of put options increases balancing any losses occurred by the portfolio. Put-protected positions do not have to be sold to curb losses. At current levels however, it seems that only a minority of equity positions are equipped with a put safety net. Once prices do fall and investors do get afraid of incurring losses, the only option is to sell. Selling results in more selling. This negative feedback loop usually results in rapidly falling prices.”
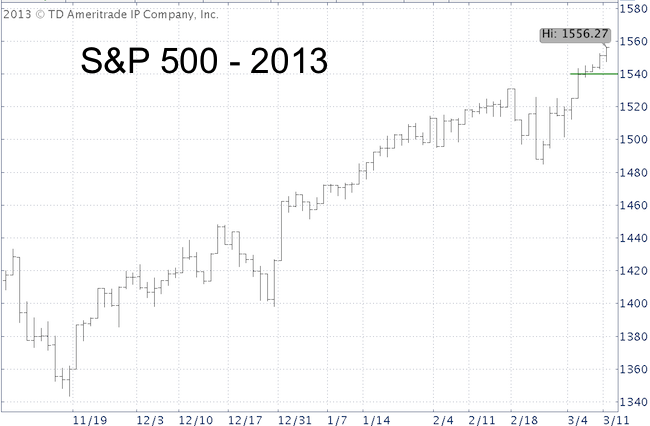
The equity put/call ratio is currently in neutral territory and the S&P 500 just posted a new top tick yesterday. The S&P would have to drop below initial support at 1,540 first. This would have to be followed by a break below key support.
The time lag between a new high and break below support should give investors enough time to turn defensive.
Seasonality suggests that the time for a Black Swan sell off is not (yet?) ripe. ‘Sell in May and go away’ has been a good strategy in most recent years, especially in 2010. March/April seasonality is not nearly as bearish as May.
In summary, the risk of an immediate Flash Crash type event is negligible, but that doesn’t mean that prices will only go up.
The potential for a Black Swan event and larger decline becomes greater if we zoom out of the very near-term into the mid-and longer-term timeframe.
|
