The iShares iBOXX $ Investment Grade Corporate Bond ETF (NYSEArca: LQD) is at or near an interesting inflection point.
LQD has been climbing higher in a rising wedge formation. Although there is no specific price barrier, a rising wedge typifies a scenario where buying pressure progressively weakens.
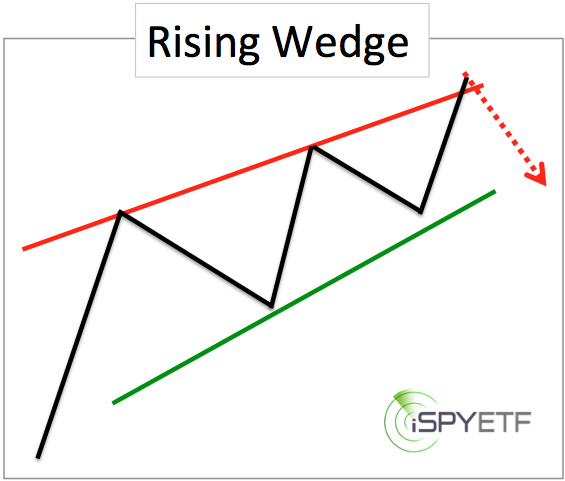
Here is where things get interesting: The wedge pattern often culminates with a throw-over top. Such a throw-over top would align well with resistance (more below).
A throw-over top is a brief spike above the upper (red) resistance line. This bull trap is designed to get investors to buy into the market just before it’s getting ready to sell off (a common down side target is the beginning of the wedge).
Here is how the wedge pattern could play out for the iShares Corporate Bond ETF (LQD):
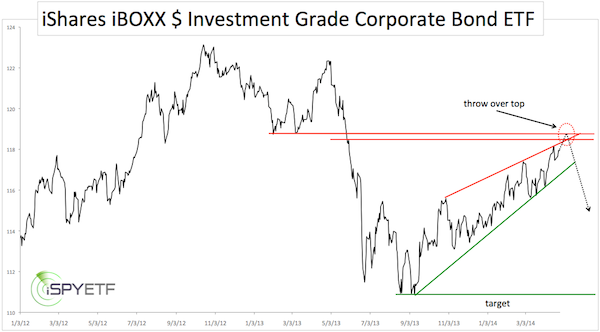
Wedge resistance is currently at 118.30. Fibonacci resistance (61.8% from the October 2012 high) is at 118.44. The February and March 2013 lows are around 118.70. This forms a resistance cluster at 118.30 – 118.70.
If LQD adheres to the guidelines of a rising wedge pattern, a brief spike into the 118.30 – 118.70 resistance cluster could be followed by a decline back to 113. Sustained trade above the upper wedge line would warn that the pattern is a no go.
The charts for other bond ETFs like the iShares Core Total U.S. Bond ETF (NYSEArca: AGG) look similar.
If you are like me, you wonder how corporate bonds affect the S&P 500 (SNP: ^GSPC).
Here’s a detailed look at how corporate bonds affect the S&P 500 in general and what a corporate bond fund break down would mean the for the S&P 500 right now.
Could a Bearish Corporate Bond Pattern Sink the S&P 500
Simon Maierhofer is the publisher of the Profit Radar Report. The Profit Radar Report presents complex market analysis (S&P 500, Dow Jones, gold, silver, euro and bonds) in an easy format. Technical analysis, sentiment indicators, seasonal patterns and common sense are all wrapped up into two or more easy-to-read weekly updates. All Profit Radar Report recommendations resulted in a 59.51% net gain in 2013.
Follow Simon on Twitter @ iSPYETF or sign up for the FREE iSPYETF Newsletter to get actionable ETF trade ideas delivered for free.

|
