The S&P 500 (SNP: ^GSPC) is trading at all-time highs and just even entertaining the idea of another rally leg makes me think of this quote:
“Anyone who believes that exponential growth can go on forever in a finite world is either a madman or an economist.”
I’m not an economist and I’d like to think that I’m no madman, but I’m starting to warm up to the idea of another sizeable rally leg.
This is partially because QE wasn’t around when Kenneth Boulding, an economist born in 1910, uttered the above words.
Although absurd when considering the economic backdrop, based on a factual and objective examination of the S&P 500 (NYSEArca: IVV) chart and investor sentiment, considerably higher stock prices are possible, even likely.
Why Now?
Stocks are nearing an overbought condition, isn’t now the wrong time to talk about another 20% rally?
The timing of this discussion is based solely on the fact that the S&P 500 (NYSEArca: SPY) has reached my long-term target around 1,750.
Technical Target Price Captured
The target was based on a 55-month long trend channel (shown in chart below) and first mentioned in the July 14 Profit Radar Report, which stated the following:
“The May 22 high did not look like a major top and the current rally doesn’t have the attributes of a major high yet either. It would be reasonable to expect some weakness with support at 1,635 followed by the next rally leg to 1,700 – 1,750.”
The October 7 Profit Radar Report confirmed the prior forecast like this: “The scenario that appears to make most sense is a quick trip into the 1,660s or 1,650s followed by another rally to new all-time highs.”
The S&P 500 chart below shows the S&P trading as high as 1,765 and Monday, tapping the upper trend channel line and capturing my long-standing target for this rally.
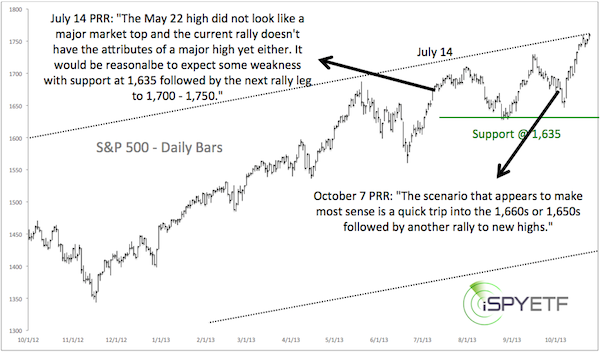
If this trend channel is going to repel the S&P 500, it needs to do so soon. Otherwise ‘persistence wears down resistance.’ Persistent trade around current levels increases the odds of higher prices.
Sentiment Analysis
Famous investor John Templeton said that: “Bull markets are born in pessimism, grow on skepticism, mature on optimism, and die on euphoria.”
Based on Templeton’s rhetoric, bull markets have four stages: Pessimism, skepticism, optimism, and euphoria.
For good reason the artificial QE bull market has been called the ‘most hated rally ever.’ Not a day goes by without banter against the Federal Reserve or Ben Bernanke.
Everyone and their grandmother knows that the Fed can’t print an economy out of trouble and that this experiment will end badly.
There’s no scientific way to prove this, but skepticism seems to be the predominant emotion of the market’s current stage.
However, to keep this analysis objective, we need to mention some rather bullish sentiment readings that popped up lately.
Bullish sentiment readings (bearish for stocks) include the equity put/call ratio, bullish asset allocation of Rydex traders, near record-high margin debt and perhaps, most importantly, a very elevated SKEW Index reading.
The SKEW Index was created by the makers of the VIX (Chicago Options: ^VIX) and – unlike the VIX (NYSEArca: VXX) - has been a trusted indicator this year.
To read about the implications of the current SKEW extreme go here: Watch Out! The S&P 500 Just got ‘SKEWed’
I personally believe that QE has changed the dynamic and the meaning of pretty much all sentiment gauges, but I also believe that understanding the composite sentiment picture holds the key to identifying the next investable low and the major top so many investors are waiting for.
Profit Radar Report subscribers know that I’ve been chronicling various sentiment indicators and actual money flow gauges for a long time. The correct interpretation of investor sentiment has kept us on the right side of the trade since the beginning of the year.
For a quick summary of how sentiment has affected trading thus far this year and an updated look at various current sentiment gauges and indicators click here: Assessing QE Bull Market Longevity Based on Current Investor Sentiment
Simon Maierhofer is the publisher of the Profit Radar Report.
Follow Simon on Twitter @ iSPYETF or sign up for the FREE Newsletter.
|
