Doing the same thing over and over again, but expecting a different outcome is often considered insanity.
By that definition, some analysts are legitimately insane. Why?
Because they’ve doomed the stock market based on bullish investor sentiment, and have been doing so for many months, even years.
You will see what I mean upon further inspection of the chart below.
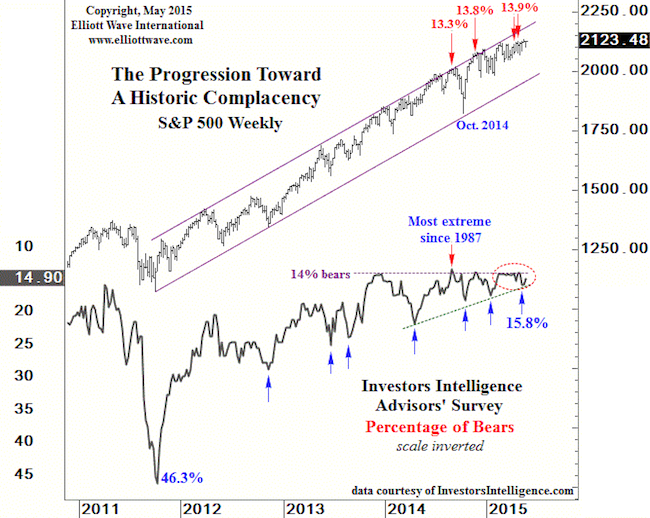
Since late 2013, the Investors Intelligence (II) survey of advisors and newsletter writers has shown (extreme) bullish sentiment.
Illustrated via the chart is the percentage of bearish advisors. This percentage has been around 14 since late 2013, which happens to be the lowest since 1987.
And since late 2013 (and way before that), Elliott Wave International (one of many market forecasting services that’s been spreading doom and gloom) has been warning that a 2008-like meltdown is directly ahead.
The cold fact is that the S&P 500 has tagged on another 20%+ since 2013.
This is not the data’s fault. It’s the interpreter’s fault … and an unfortunate symptom of tunnel vision. Perhaps the II poll has just become too popular to be effective as contrarian indicator, and lost its mojo.
II is not the only sentiment data available, and it's the analyst's responsibility to determine the validity of the II survey in context with other sentiment data. Now more than ever, it’s important to widen the horizon and look at other sentiment gauges.
The Profit Radar Report monitors dozens of sentiment indicators and consistently publishes at least six every month.
For example, the February 19 Profit Radar Report Sentiment Picture summed things up as follows: “In short, sentiment is elevated, and may be a short-term drag, but is not indicative of a major market top.”
Stay in the loop. Sign up for the FREE iSPYETF Newsletter to receive hand-crafted research like this.
Throughout 2013 and 2014, the Profit Radar Report pointed out the lack of excessive optimism and likelihood of higher stock price (click here for a more complete record or the 2014 sentiment analysis).
Here is a look at the latest Sentiment Picture, published on May 29.
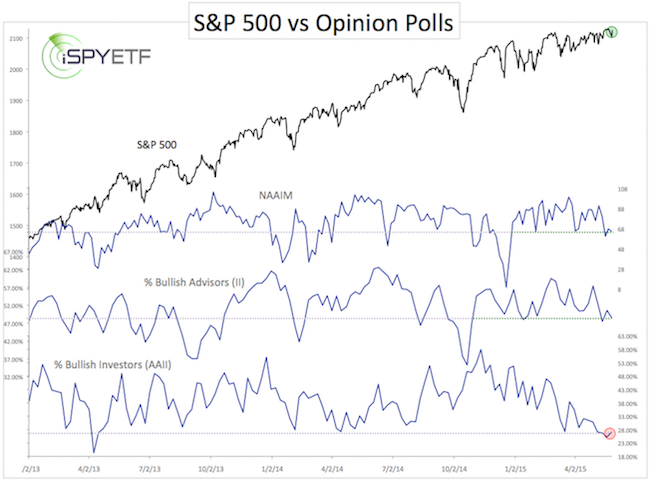
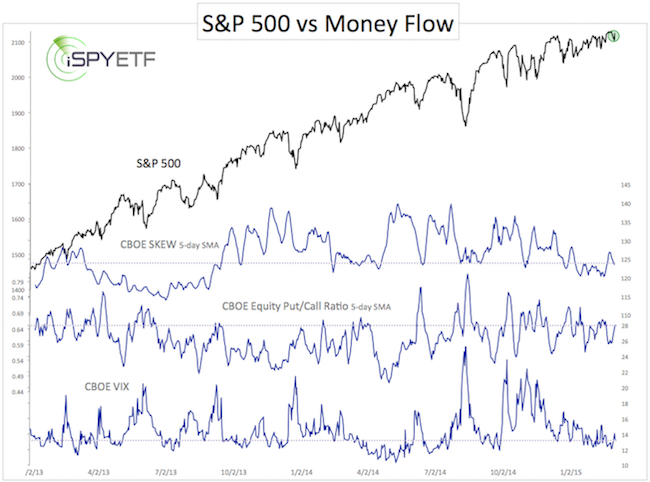
The two charts categorize various sentiment gauges as either opinion poll (what investors say) or money flow (what investors do).
The American Association for Individual Investors (AAII) and National Association of Active Investment Managers (NAAIM) opinion surveys do not confirm the bullish (bearish for stocks) tone of the Investors Intelligence poll.
Three other sentiment gauges more closely related to actual money flow do not show any real extremes.
What’s the moral of the story?
Don’t trust fear mongers or ‘one trick pony’ predictions based on any single sentiment gauge.
We live in a complex world. We need complex analysis.
Oh, on by the way, purely based on sentiment, stocks could continue to grind higher.
Simon Maierhofer is the publisher of the Profit Radar Report. The Profit Radar Report presents complex market analysis (S&P 500, Dow Jones, gold, silver, euro and bonds) in an easy format. Technical analysis, sentiment indicators, seasonal patterns and common sense are all wrapped up into two or more easy-to-read weekly updates. All Profit Radar Report recommendations resulted in a 59.51% net gain in 2013 and 17.59% in 2014.
Follow Simon on Twitter @ iSPYETF or sign up for the FREE iSPYETF Newsletter to get actionable ETF trade ideas delivered for free.

Never Miss a Beat! >> Sign up for the FREE iSPYETF e-Newsletter
|
