The last time we looked at buying climaxes was on May 28, 3013. At that time there were 864 buying climaxes in one week.
Over the next month the S&P 500 (SNP: ^GSPC) lost as much as 114 points (6.8%).
Buying climaxes take place when a stock makes a 52-week high, but closes the week with a loss.
According to Investors Intelligence (II), which tracks buying climax data, they are a sign of distribution and indicate that stocks are moving from strong hands to weak ones.
The last two weeks saw back-to-back readings of 386 and 380 buying climaxes, the second highest selling activity in 2013.
The chart below shows the number of buying climaxes with an overlay of the S&P 500 (NYSEArca: SPY).
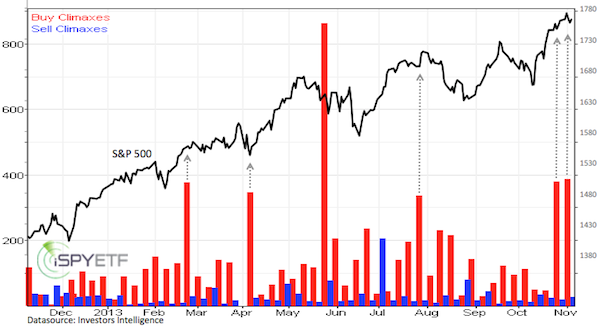
The small cap sector (NYSEArca: IJR) and interest rate sensitive sectors such as financials (NYSEArca: XLF) saw a large concentration of buying climaxes.
A substantial increase in buying climaxes doesn’t always result in falling stock (NYSEArca: IWM) prices, but it is an obvious warning.
Buying climaxes aren’t the only red flag. A number of sentiment polls have reached multi-month, multi-year, and record extremes.
Those shouldn’t be ignored, because the S&P 500 and Nasdaq are in a technical ‘make it or break it’ zone.
The following article reveals the more than decade long resistance levels stocks are struggling to surpass.
Nasdaq and S&P 500 Held Back by ‘Magic Resistance’”
Simon Maierhofer is the publisher of the Profit Radar Report.
Follow Simon on Twitter @ iSPYETF or sign up for the FREE Newsletter.
|
