Camouflage is defined as disguising the presence of a person, animal or object. Here’s a slightly different kind of camouflage:
The S&P 500 and Dow Jones are currently ‘camouflaging’ this week's new all-time highs of the Russell 2000 (NYSEArca: IWM) and S&P MidCap 400 (NYSEArca: MDY). Also, despite weakness in the large cap sector, the Nasdaq-100 (Nasdaq: QQQ) just recorded a new 13-year high.
The Nasdaq (Nasdaq: ^GSPC) offers unique insight for market forecasters like myself. Why? Because it remains below its all-time high and therefore still has to deal with overhead resistance.
In fact, the Nasdaq is within striking distance of my double long-term Fibonacci target.
This target was identified via the July 10, 2013 edition of the Profit Radar Report, which stated:
“The most likely target for the Nasdaq-100 is 3,265 – 3,280, which is about 8.5% away. The up side potential for the Nasdaq-100 is larger than for the S&P 500 (NYSEArca: SPY). Apple may step up to the plate and help the Nasdaq-100 get there.”
Since this July 10 Profit Radar update the Nasdaq climbed 8.2%, driven by Apple, which soared 16%.
What Now?
Our forecast is on track, but we must be aware of these two issues:
1) The Nasdaq-100 is less than 1% away from our double Fibonacci target. This convergence of reliable long-term Fibonacci levels also serves as resistance.
2) The S&P 500 (and S&P 500 ETF) is significantly underperforming compared to the Nasdaq-100 and is still far away from its respective target.
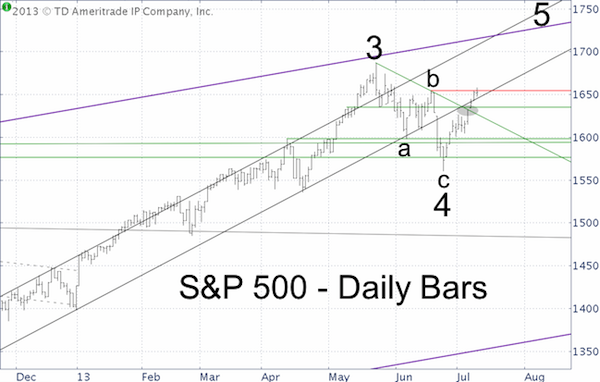
The S&P 500 target was outlined via the above chart (also featured in the July 10 Profit Radar Report). I was a bit off with the timing on the above July 10 projection, but the S&P followed the basic path and got very close to my target (it reached 1,730 on September 19).
The target was based on an ascending multi-year trend channel. I have a feeling the S&P will make another attempt to hit this channel later on this year.
The Challenge
We are basically dealing with two indexes at different 'life' stages. You could also call it a divergence or contradiction.
Nobody knows what trick the market has up its sleeve, but we know that Mr. market usually does exactly what fools the greater number of investors.
I am currently tracking two possible resolutions that will do exactly that. One involves are near-term break down, the other a near-term buying opportunity. As always, I’ll share my findings via the Profit Radar Report first.
Simon Maierhofer is the publisher of the Profit Radar Report.
Follow Simon on Twitter @ iSPYETF or sign up for the FREE Newsletter.
|
