|
|
| Bullish Russell 2000 Signals – Will They Last? |
| By, Simon Maierhofer
|
| Tuesday October 21, 2014 |
|
|
|
|
| The Russell 2000 has weighted down the broad stock market since March. Now, for the first time in a while, the Russell 2000 is actually outperforming large cap stocks. Does that mean that small caps will lead the market higher? |
|
The Russell 2000 is showing signs of life, after months of underperformance relative to the S&P 500.
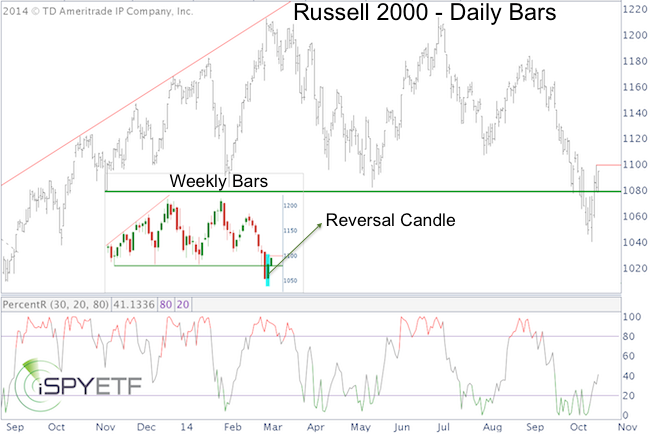
The Russell 2000 is one of the only indexes (along with the MidCap 400) that painted a green reversal candle (see chart insert).
Prior to erasing last week’s losses, the Russell 2000 also dipped to a 52-week low. A weekly reversal after a 52-week low is also considered a selling climax.
605 stocks recorded selling climaxes last week. This is the highest count of selling climaxes since October 2011, which marked a major bottom (more details here: Selling Climaxes Soar to 4-year High).
Complex Analysis Made Easy - Sign Up for the FREE iSPYETF E-Newsletter
From a technical perspective, here are a few Russell 2000 developments to keep in mind:
-
Bullish: Last week’s green reversal candle pushed the Russell 2000 back above support at 1,080.
-
Almost Confirmed: The chart below shows one indicator I like to monitor when it comes to spotting trend changes. On the short-term daily chart, this indicator requires a close above Friday’s high. The same is true for the weekly chart.
-
Confirmation Needed: The IWM:IWB ratio shows the performance of small caps (IWM Russell 2000 ETF) relative to large caps (IWB Russell 1000 ETF). The IWM:IWB ratio is about to test prior support, now resistance.
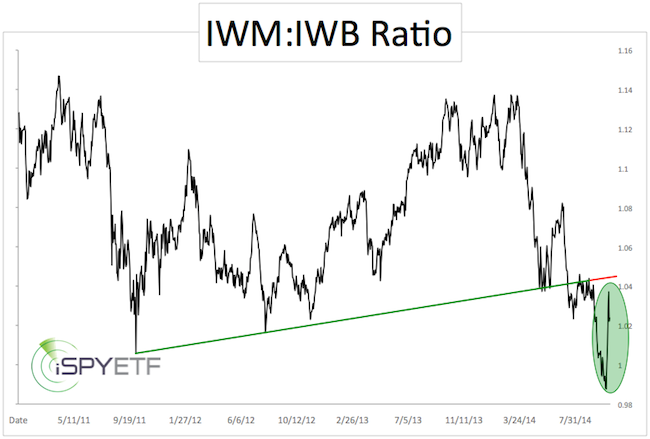
Unless the ratio can move above 1.05, small caps are likely to continue underperforming their large cap cousins.
In short, the Russell 2000 is showing strength, and odds of continued up side are increasing.
Simon Maierhofer is the publisher of the Profit Radar Report. The Profit Radar Report presents complex market analysis (S&P 500, Dow Jones, gold, silver, euro and bonds) in an easy format. Technical analysis, sentiment indicators, seasonal patterns and common sense are all wrapped up into two or more easy-to-read weekly updates. All Profit Radar Report recommendations resulted in a 59.51% net gain in 2013.
Follow Simon on Twitter @ iSPYETF or sign up for the FREE iSPYETF Newsletter to get actionable ETF trade ideas delivered for free.

|
|
|
|
|
|
|
|
|
|
|
|
|
|
