2015 has been exciting. Not a stale moment. 1%+ daily S&P 500 moves have become the norm. Very unlike 2014, where we had months without moves greater than 1%.
For a market forecaster and commentator like myself, this has been exciting, but it may have been a frustrating trip through seesaw booby traps for many investors.
As soon as investors feel like they may have gotten a handle on things, the S&P 500 changes direction.
The blue box highlights the next potential S&P 500 (NYSEArca: SPY) trap, conveniently located and ready to snap right around 2,065+.
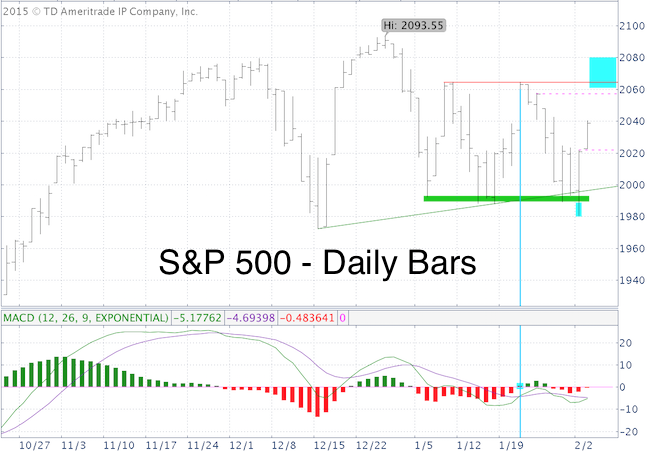
The S&P 500 hit 2,065 on January 22 (blue line); the very day MACD triggered a buy signal.
We were looking to short that bounce, as mentioned in the January 21 Profit Radar Report: “Stocks are moving in the right direction for our short setup. The S&P 500 is close to the 2,040 - 2,070 zone mentioned Sunday.”
After losing 80 points, the S&P visited the lower end of the trading range, with obvious support at 1,980 (green bar).
On Sunday (February 1), the Profit Radar Report warned that: “Near-term support around 1,990 is becoming quite obvious. When support is too obvious, the market may want to fool investors with a seesaw.”
On Monday the S&P sliced below 1,990, took out tons of stops, and reversed strongly.
The push of the low showed good internal strength and is likely to lift the S&P higher. The open chart gap at 2,057 should act as initial target.
Any move to and above 2,065 increases the odds of another leg down. Perhaps the S&P will even close above 2,065 for a day or two. It would be an even better booby trap.
Simon Maierhofer is the publisher of the Profit Radar Report. The Profit Radar Report presents complex market analysis (S&P 500, Dow Jones, gold, silver, euro and bonds) in an easy format. Technical analysis, sentiment indicators, seasonal patterns and common sense are all wrapped up into two or more easy-to-read weekly updates. All Profit Radar Report recommendations resulted in a 59.51% net gain in 2013 and 17.59% in 2014.
Follow Simon on Twitter @ iSPYETF or sign up for the FREE iSPYETF Newsletter to get actionable ETF trade ideas delivered for free.

|
