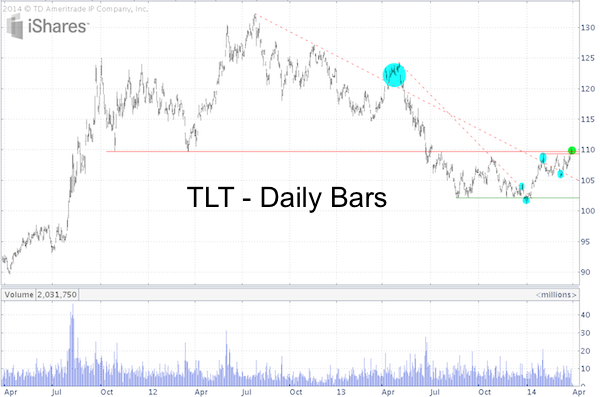
A number of technical analysts believe to have identified a bullish technical breakout for the iShares 20+ Year Treasury ETF (NYSEArca: TLT).
The TLT Treasury ETF chart below highlights Thursday’s breakout (green bubble).
At first glance, TLT’s push above resistance qualifies as a breakout.

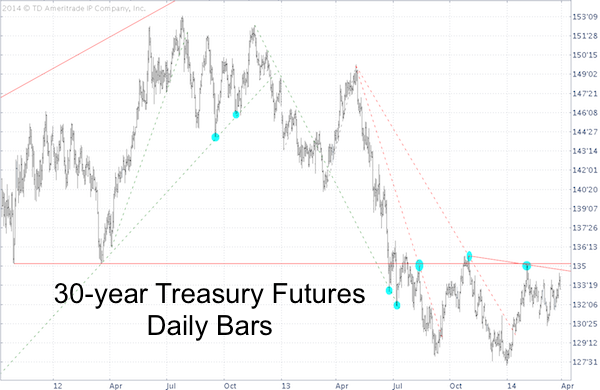
As great as ETFs are, I personally prefer to use the purest representation of an asset class as a foundation for my analysis. For long-term Treasuries, that’s the 30-year Treasury Futures (/ZB).
The 30-year Treasury Futures chart looks slightly different. Trade has not yet broken above resistance.

Both charts include all (trend line) support/resistance levels and how prices reacted (blue bubbles).
TLT has been more prone to false breakouts or breakdowns than futures.
This doesn’t mean 30-year Treasury futures won’t break out. Bullish TLT action may act as a magnet and pull prices higher. The prudent approach is to wait until futures confirm TLT (especially sinse TLT's breakout didn't occur on highly elevated volume).
The action of Treasuries may also provide important clues for the S&P 500 (SNP: ^GSPC). The S&P 500 has been stuck in a rut for all of 2014 and a Treasury breakout may coincide with an S&P 500 breakdown.
Just as Treasuries have to confirm a bullish breakout, the S&P 500 has yet to confirm a break down.
This following article features the messiest S&P 500 chart I've ever published. But ironically it may explain the stock market's up-and down better than any other chart:
Short-Term S&P 500 Forecast
Simon Maierhofer is the publisher of the Profit Radar Report. The Profit Radar Report presents complex market analysis (S&P 500, Dow Jones, gold, silver, euro and bonds) in an easy format. Technical analysis, sentiment indicators, seasonal patterns and common sense are all wrapped up into two or more easy-to-read weekly updates. All Profit Radar Report recommendations resulted in a 59.51% net gain in 2013.
Follow Simon on Twitter @ iSPYETF or sign up for the FREE iSPYETF Newsletter to get actionable ETF trade ideas delivered for free.

|