Gold hasn’t gone anywhere fast in a few weeks, but is down 20 points today.
According to the financial media, there are various reasons why gold is down:
“Gold falls 2% as dollar climbs on Fed” – Reuters
“Gold lower on stronger U.S. dollar, rebound in stock market” – Forbes
“Gold edges lower as Chinese support fades ahead of holiday” – CNBC
“Gold prices fall on stimulus, demand outlook” Economic Times
Wow, there are many reasons, but no unanimous consent. According to Forbes, gold is down because the S&P 500 and dollar are up. CNBC blames ‘Chinese support,’ whatever that means.
Simple but Effective
The following piece of gold trivia shows that every investor could easily see why gold is down today.
All the information needed is contained in the gold chart below. Can you see why gold is down today?
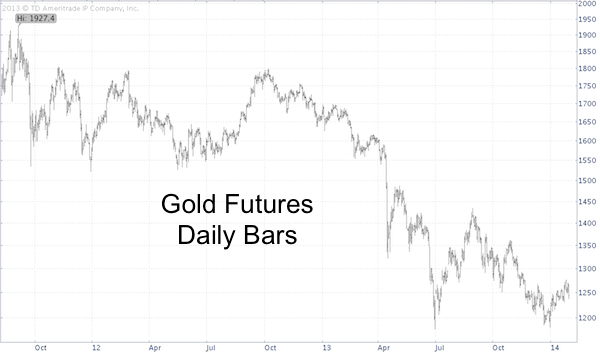
If you can’t see it, look at the second chart. What a difference just one line makes.

The silver chart paints the same picture, even more compelling.
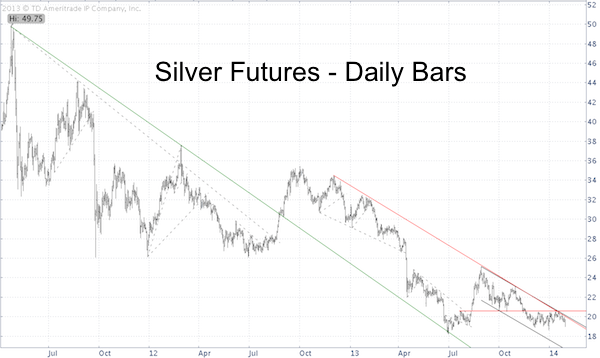
The Profit Radar Report has been watching the gold and silver trend line for weeks. Initially they acted as a magnet and drew prices higher. Lately, they have acted as resistance and rejected price.
Although I prefer to analyze the purest representation of an asset, it’s noteworthy that the chart for corresponding gold and silver ETFs, the SPDR Gold Shares (NYSEArca: GLD) and iShares Silver Trust (NYSEArca: SLV), look similar.
Long-Term Outlook
What about the longer-term outlook for gold and silver?
The December 29 Profit Radar Report featured this longer-term forecast:
“Gold prices have steadily declined since November, but we haven’t seen a capitulation sell off yet. Capitulation is generally the last phase of a bear market. It flushes out weak hands. Prices can’t stage a lasting rally as long as weak hands continue to sell every bounce.
Gold sentiment is very bearish (bullish for gold) and prices may bounce here. However, without prior capitulation, any rally is built on a shaky foundation and unlikely to spark a new bull market.
We would like to see a new low near-term resistance is at 1,255 +/-. “
Any gold and silver rally prior to a new multi-year low seems doomed. Nevertheless, the string of higher highs and lower lows has yet to be broken and a close above the highlighted gold and silver trend lines would temporarily extend the current bounce and unlock higher targets.
How low will gold and silver have to go? There is a strong confluence of trend lines (similar to the ones highlighted above) that should act as a magnet for prices and serve as a foundation for a sizeable rally.
Detailed targets for a lasting low are outlined by the Profit Radar Report.
Simon Maierhofer is the publisher of the Profit Radar Report. The Profit Radar Report presents complex market analysis (stocks, gold, silver, euro and bonds) in an easy format. Technical analysis, sentiment indicators, seasonal patterns and common sense are all wrapped up into two or more easy-to-read weekly updates. All Profit Radar Report recommendations resulted in a 59.51% net gain in 2013.
Follow Simon on Twitter @ iSPYETF or sign up for the FREE iSPYETF Newsletter to get actionable ETF trade ideas delivered for free.

|
