The last free S&P 500 forecast (published February 7) titled ‘Short-Term Gain vs Long-Term Pain’ requires some slight adjustments.
The ‘Short-Term Gain vs Long-Term Pain’ article featured a portion of this visual projection originally published in the February 5 Profit Radar Report.
As the chart shows, starting on February 5, the Profit Radar Report expected a strong rally to S&P 1,830 followed by another leg down.
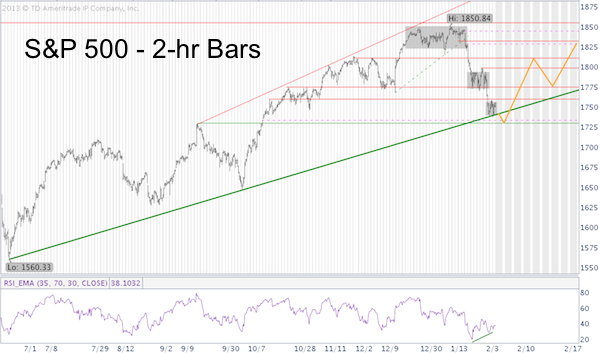
The S&P 500 not only rallied to 1,830, it also closed the open chart gap at 1,845 and challenged Fibonacci projection resistance (going back to the 2002 low) at 1,855.
While a big portion of the forecast (rally from 1,737 to 1,830) followed the script, the subsequent expectation of ‘another leg down’ did not materialize.
This week’s new S&P 500 (SNP: ^GSPC) high alters the structure and likely postpones the immediate threat of new lows.
For now we note that the S&P 500 (NYSEArca: SPY) is struggling to move above resistance at 1,851 – 1,855.
While the S&P 500 has already climbed to new all-time highs, the Dow Jones has yet to retrace a Fibonacci 78.6% of the prior decline.
The Dow Jones chart below shows the U.S. Grand Daddy of indexes struggling with trend line resistance and Fibonacci resistance at 16,215 – 16, 320.
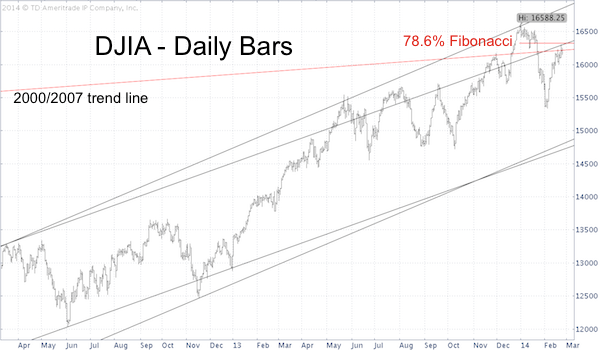
In summary, sustained S&P 500 trade above 1,855 would rejuvenate the technical picture for the S&P 500, but the Dow below 16,320 and below its prior ATH at 16,588, will likely be a drag on the S&P’s up side.
Regular updates along with short and long-term forecasts and real buy/sell recommendations are provided via the Profit Radar Report.
Here's one indicator that's consistently capped up side and often caused quite some turmoil:
Indicator: Risk of 'Black Swan' Event is Elevated
Simon Maierhofer is the publisher of the Profit Radar Report. The Profit Radar Report presents complex market analysis (S&P 500, Dow Jones, gold, silver, euro and bonds) in an easy format. Technical analysis, sentiment indicators, seasonal patterns and common sense are all wrapped up into two or more easy-to-read weekly updates. All Profit Radar Report recommendations resulted in a 59.51% net gain in 2013.
Follow Simon on Twitter @ iSPYETF or sign up for the FREE iSPYETF Newsletter to get actionable ETF trade ideas delivered for free.

|
