Seasoned investors look at many indicators before making buy/sell decisions. One of them should be sentiment.
My personal ‘three pillars of market forecasting’ are technical analysis, seasonality, and sentiment.
Technical analysis includes trend lines, patterns (like triangle, head-and shoulders, etc.), Fibonacci levels, divergences and so on.
Seasonality includes seasonal patterns and cycles for broad indexes and sometimes individual stocks (such as Apple seasonality) and sectors.
Sentiment can be subdivided into many segments. I consistently follow more than a dozen sentiment and money flow gauges and regularly chart the following five for Profit Radar Report subscribers:
CBOE Volatility Index (Chicago Options: ^VIX)
CBOE Skew Index
CBOE Equity Put/Call Ratio
% of bullish advisors polled by Investors Intelligence (II)
% of bullish investors polled by the American Association for Individual Investors (AAII)
The chart below is a reprint of the July 25 Sentiment Picture (available to subscribers of the Profit Radar Report).
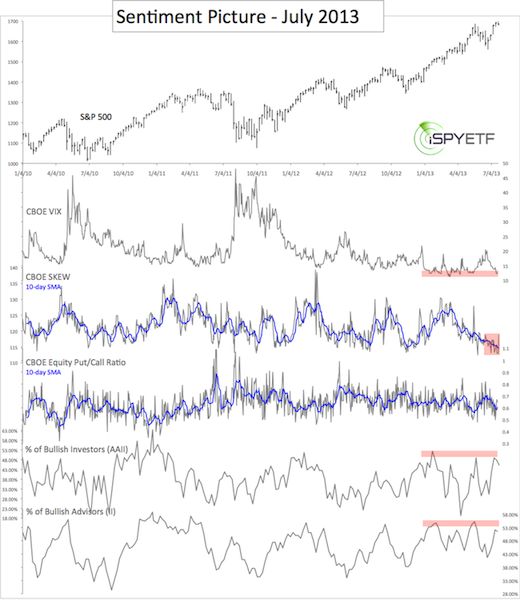
It plots the S&P 500 (SNP: ^GSPC) against the above-mentioned sentiment gauges.
The VIX (NYSEArca: VXX) continues to linger near a multi-year low. This has been the case for almost a year. Using the VIX to time market highs has been a fool’s errand. We realized that back in November 2012 when the Sentiment Picture 'quarantined' the VIX:
“When an indicator doesn’t work, we’ll put it on ‘probation' until it proves its worth again.” Let’s just say the VIX has continued to be on probabation.
The put/call ratio is a valuable member of the sentiment family. The May 19 Sentiment Picture noted that option traders were finally jumping on the rally bandwagon and warned that: “Risk is rising. A fair portion of current gains should be quickly retraced.” The S&P 500 (NYSEArca: SPY) quickly lost 7% thereafter before rebounding.
Sentiment polls by Investors Intelligence (II) and the American Association of Individual Investors (AAII) are a ‘casualty’ of the QE liquidity market and need to be taken with a grain of salt.
Extreme bullishness reflected in the polls hasn’t had much of an impact on stocks, but bearish extremes have coincided with rallies.
The April 26 Sentiment Picture for example picked up on the extremely bearish AAII poll numbers and the large number of II folks looking for a correction and wrote:
“36% of advisors and newsletter writers polled by Investor's Intelligence (II) are looking for a correction. Incidentally, that's exactly what we are expecting. However, the market rarely fulfills the expectation of the masses.” In other words: expect higher prices.
It took years of trial and error to become familiar with the various sentiment gauges and learn how to interpret the different readings. I have found that there's a difference between sentiment polls and money flow indicators. The equity put/call ratio, for example, is an indicator that shows if investers are really 'putting their money where their mouth (sentiment polls) is.'
When the put/call ratio finally reached extreme territory in May (and investors started to put their money where their mouth is), the stock market turned sour, at least temporarily. A updated chart and analysis of the equity put/call ratio is available here: "Is a Market Top Near? 'Smart' Option Traders Send a Curious Message."
Continuous sentiment analysis is available via the Profit Radar Report.
Follow Simon on Twitter @ iSPYETF.com or sign up for the FREE e-newsletter
Related article: New Stanford University Index Gauges Media Sentiment
|
