Autumn is an exciting time for Apple geeks, but a treacherous time for Apple (Nasdaq: AAPL) shareholders.
Product rumors are planted in the spring and ripen in the fall as rumors mature towards tangible reality. Apple fans are hoping to feel, touch and buy a big screen iPhone or even an iWatch.
Ironically the autumn excitement doesn’t spill over to AAPL shares. September 21, 2012 was the kickoff for a 45% correction and August 19, 2013 saw a 12% pullback.
The August 24 Profit Radar Report summed up Apple’s position like this: “AAPL rallied to new all-time highs. As the chart shows, AAPL is just above green trend line support and just below red trend line resistance. Seasonality points higher for another few weeks before the biggest seasonal weak spot of the year (AAPL topped on Sep. 22, 2012 at 705, split-adjusted). In short, the path of least resistance is up, as long as AAPL doesn’t close below 100. Danger will rise in mid-September.”
A detailed full-year AAPL seasonality chart is available here.
The chart below shows the various trend lines and support/resistance levels mentioned.
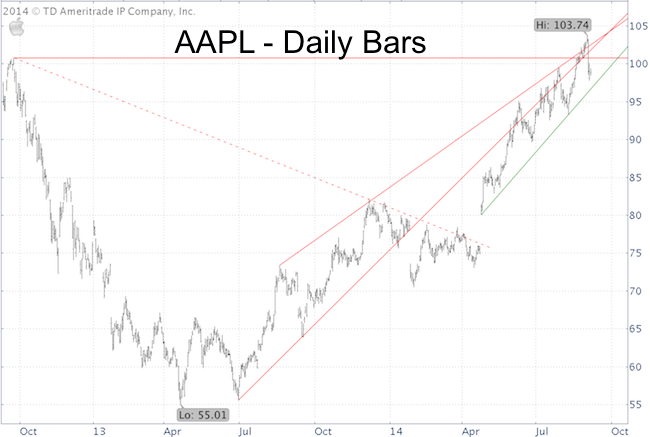
AAPL sliced below 100 on Thursday. Support around 100 has now become resistance. Green trend line support is at 97.
Based on seasonality, risk is rising and the path of least resistance is down as long as trade remains below 100 – 101.
Apple's 'bad Thursday' spilled over to the Nasdaq-100 as the PowerShares QQQ ETF (Nasdaq: QQQ) painted a big red candle.
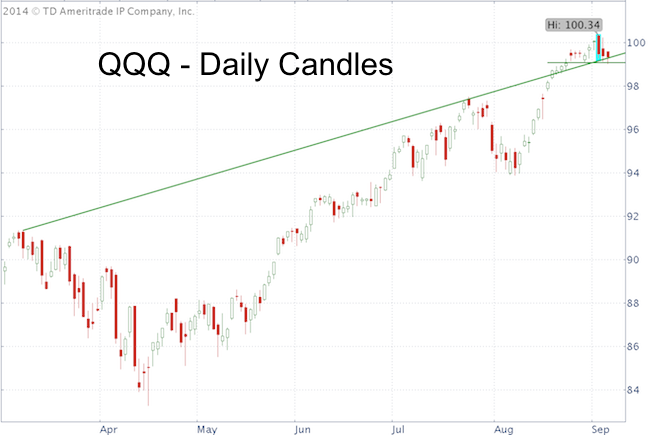
Thus far, QQQ remains above support at 99. A close below 99 may elicit more selling.
Simon Maierhofer is the publisher of the Profit Radar Report. The Profit Radar Report presents complex market analysis (S&P 500, Dow Jones, gold, silver, euro and bonds) in an easy format. Technical analysis, sentiment indicators, seasonal patterns and common sense are all wrapped up into two or more easy-to-read weekly updates. All Profit Radar Report recommendations resulted in a 59.51% net gain in 2013.
Follow Simon on Twitter @ iSPYETF or sign up for the FREE iSPYETF Newsletter to get actionable ETF trade ideas delivered for free.

|
