As mentioned in the Short-Term S&P 500 Analysis, the S&P 500 nearly hit important support located at 1,902 – 1,885 (click here for chart with visual).
Just before the S&P 500 (NYSEArca: SPY) approached this key support cluster, there was a buy signal by two option-based indicators.
The charts and commentary below were published in the August 6 Profit Radar Report.
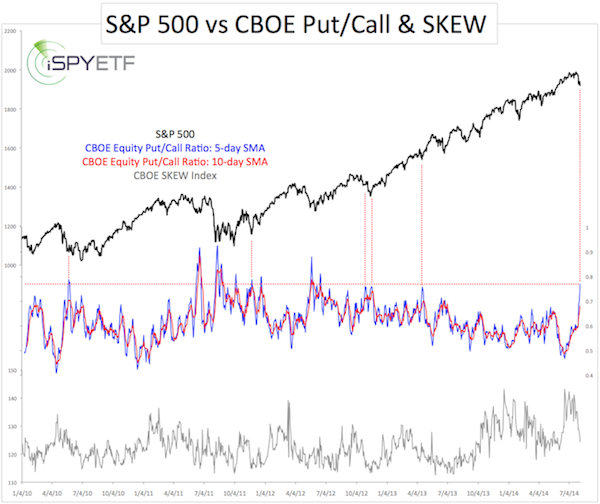
“The 5-day SMA of the CBOE Equity Put/Call Ratio just spiked to a two year high. Options traders are more bearish today than any other time since June 2012. Obviously 2012 and 2013 were unusual years and may not be the best benchmarks, but nevertheless this is a noteworthy extreme.”
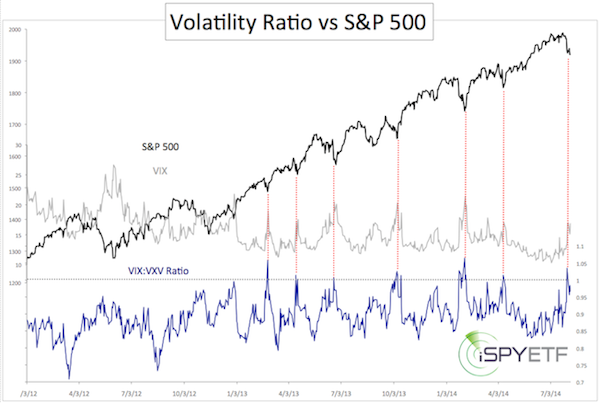
“The VIX:VXV ratio briefly poked above 1 on August 1. This means that expected 1-month volatility (VIX) was higher than 3-month volatility (VXV). All 2012 and 2013 spikes above 1 marked lows for the S&P 500 and highs for the VIX.”
The message of various indicators was summarized as follows by the August 6 Profit Radar Report:
“The longer-term S&P 500 chart shows key support at 1,885 – 1,902. This would be the ideal target for a tradable low (a drop to support at 1,850 is only a low probability). However, the 100-day SMA is at 1,913 and the August s1 pivot is at 1,910. In essence, support/resistance levels confirm the message of EWT: A low is either already in place or nearly so.”
Unfortunately, the above two indicators don’t tell us how long this bounce will last.
We will be looking at various other gauges to judge the longevity of this bounce.
One clue comes from the VIX. VIX seasonality triggered a major buy signal on July 9 (which has been spot on), but sports a brief bearish window right now.
More details here: VIX Seasonality Sports Brief Bearish Window
Simon Maierhofer is the publisher of the Profit Radar Report. The Profit Radar Report presents complex market analysis (S&P 500, Dow Jones, gold, silver, euro and bonds) in an easy format. Technical analysis, sentiment indicators, seasonal patterns and common sense are all wrapped up into two or more easy-to-read weekly updates. All Profit Radar Report recommendations resulted in a 59.51% net gain in 2013.
Follow Simon on Twitter @ iSPYETF or sign up for the FREE iSPYETF Newsletter to get actionable ETF trade ideas delivered for free.

|
