I researched volatility the other day and made two interesting discoveries:
-
Based on real volatility – actual price movements, not the VIX – 2015 is the most volatile year since 2009, and thus far mimics 2011.
-
There are actually a number of similarities between the year 2011 and 2015.
Here is why those similarities could be interesting:
The S&P 500 fell 20% in July/August 2011. 18% of that loss happened within a 3-week meltdown.
Could the same happen in 2015?
Here are three striking similarities between 2015 and 2011:
-
2015, like 2011 is a pre-election year.
-
Thus far, the 2015 chart looks like the 2011 chart (see below).
-
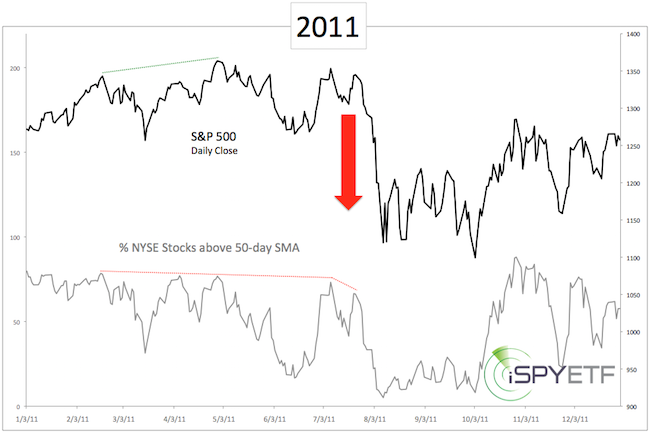
Stocks are internally weak right now, like they were before the 20% drop in 2011. Internally weak in this instance means that more and more stocks are falling below their 50-day SMA despite new S&P 500 highs.
The first chart plots the S&P 500 against the percentage of stocks above their 50-day SMA in 2011.
If you enjoy quality, hand-crafted research, >> Sign up for the FREE iSPYETF Newsletter
The massive 2011 July/August summer drop was preceded by several months of bearish divergences.
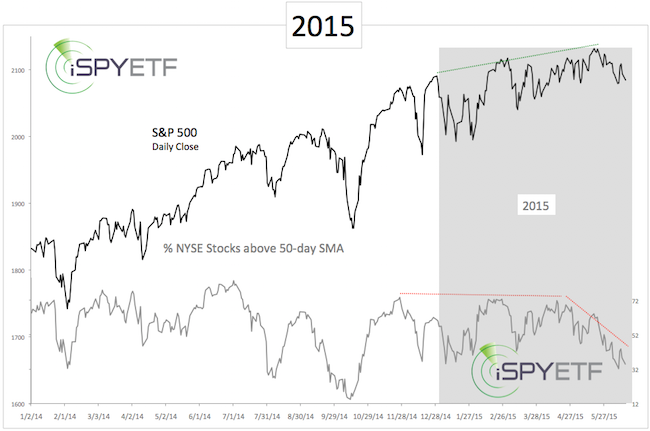
The second chart shows that similar divergences exist right now.
The third chart compares the S&P 500 of 2011 with the S&P 500 year-to-date.
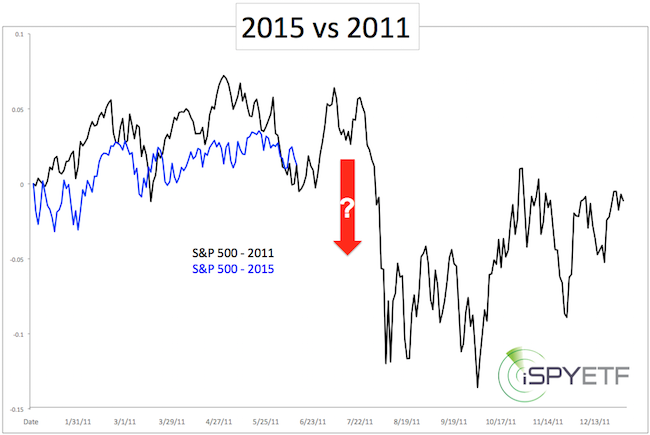
If the analogy holds up, we're in for a wild ride (up, down, up), but little net progress at the end of the year.
Simon Maierhofer is the publisher of the Profit Radar Report. The Profit Radar Report presents complex market analysis (S&P 500, Dow Jones, gold, silver, euro and bonds) in an easy format. Technical analysis, sentiment indicators, seasonal patterns and common sense are all wrapped up into two or more easy-to-read weekly updates. All Profit Radar Report recommendations resulted in a 59.51% net gain in 2013 and 17.59% in 2014.
Follow Simon on Twitter @ iSPYETF or sign up for the FREE iSPYETF Newsletter to get actionable ETF trade ideas delivered for free.

If you enjoy quality, hand-crafted research, >> Sign up for the FREE iSPYETF Newsletter
|
